
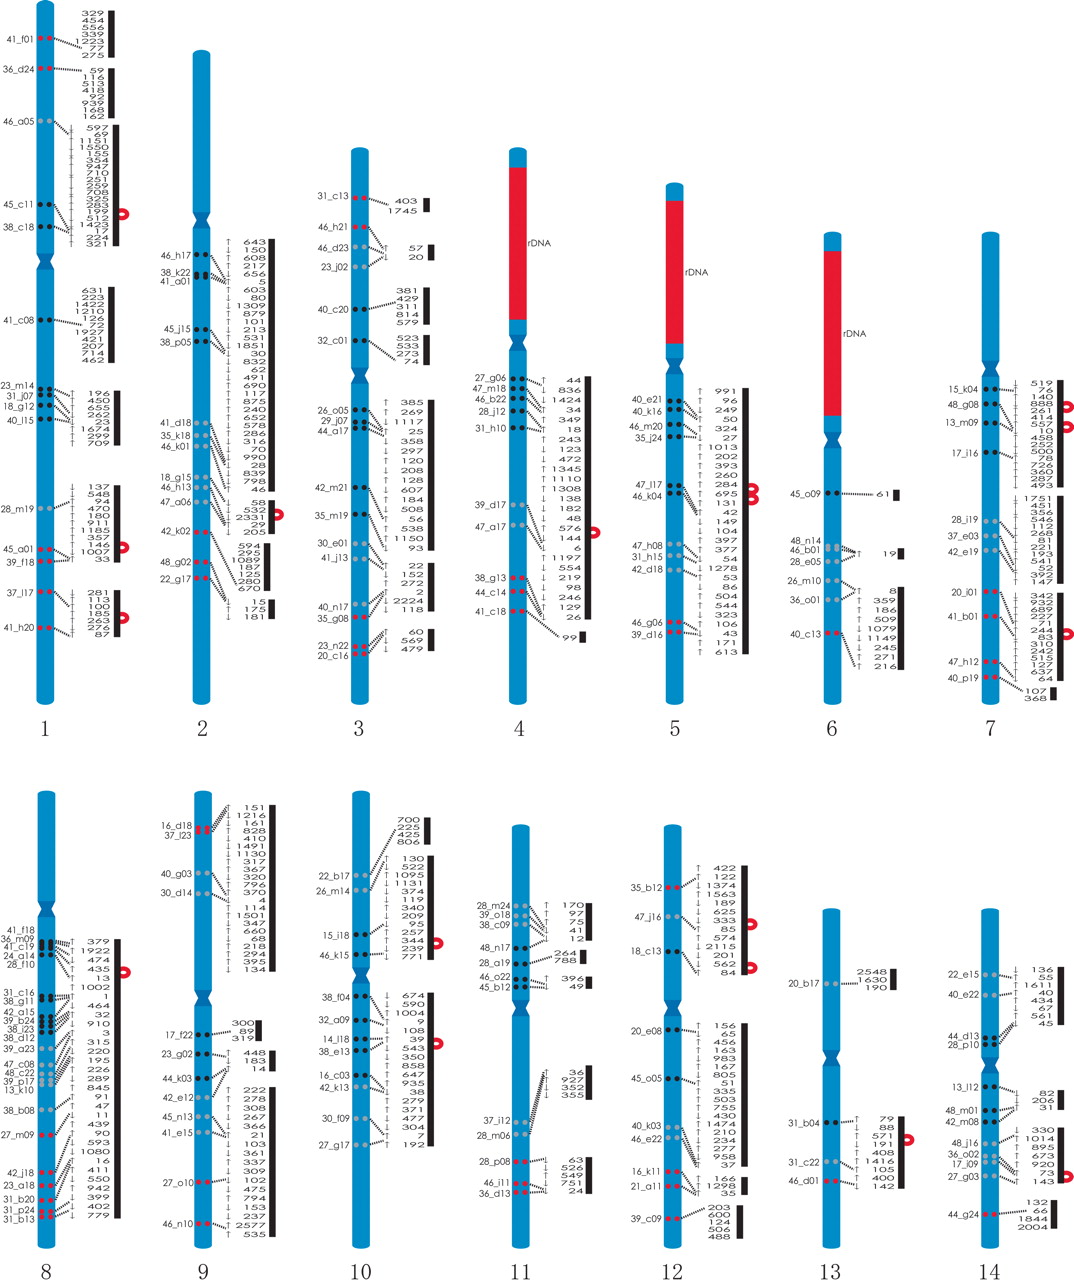
Mapping of BAC clones and draft genome sequence (version 1) onto C. intestinalis chromosomes. The locations of 170 FISH-mapped BACs are shown relative to DAPI-counterstained chromosomes with centromere bands (at an approximately relative scale). Clones that mapped proximal to the centromere are represented by a pair of black circles. Clones that mapped distal to the centromere are represented by a pair of red circles, and those that mapped to the middle portion of the arms are shown by a pair of gray circles. Red areas indicate three regions with rDNA clusters on the short arms of chromosomes 4, 5, and 6. The paired-BAC end sequences assembled the 468 scaffolds into 48 joined scaffolds and three scaffolds that were not joined to any of the others, as shown by bold lines. Seventeen scaffolds assembled using one pair of BAC end sequences for each are shown by red curved lines (for example, Scaffold_199 and Scaffold_512) and map to regions in between FISH-mapped BACs. Arrows on the left side of the scaffold number indicate the orientation of the mapped sequences.


