
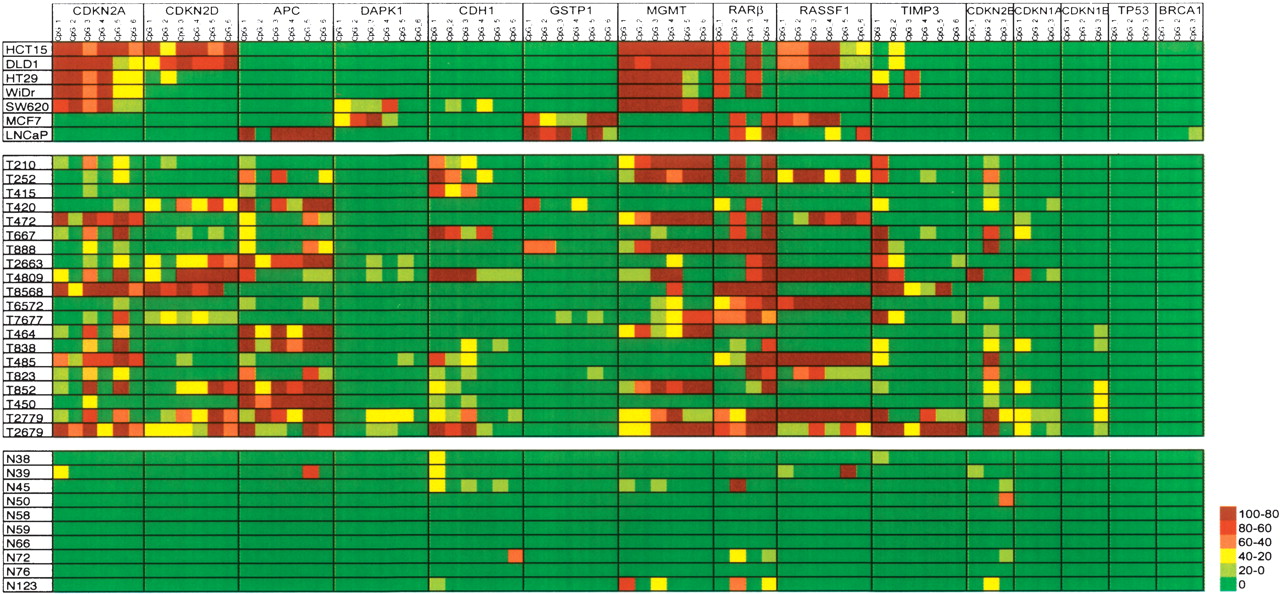
Selected examples of DNA methylation profiles of cancer cell lines and clinical samples. Five colorectal (HCT15, DLD-1, HT29, WiDr, and SW620), one breast (MCF7), one prostate (LNCaP) cancer cell lines, 20 primary colorectal cancer (T series), and 10 adjacent normal tissues (N series) were analyzed. Six CpG sites per promoter region were analyzed in each sample except CDKN2B, CDKN1A, CDKN1B, TP53, and BRCA1. Standard curves were not established for the genes mentioned above since hypermethylation is not reported in the literature or observed in our clinical sample study. The standard curves should be established when applying this assay to other tumor types such as breast cancer. Around 10%-15% established CpG methylation standard curves gave lower R2 values (between low 80s and 70s), including CDKN2A (CpG_3 and CpG_6), CDKN2D (CpG_1), GSTP1 (CpG_3), DAPK1 (CpG_3), RASSF1 (CpG_4), and TIMP3 (CpG_2). Only four CpG sites of RARB were shown due to defects on zip-code addresses during array fabrication. The color scale represents the percentage of methylation levels determined from the standard curves at each CpG dinucleotide. Notice that for the cell lines HCT15/DLD-1 and HT29/WiDr, each pair is derived from a same tissue origin reflected in their identical methylation patterns. The PCR and LDR primer sequences and their concentrations used in these experiments are listed in the Supplemental Tables 3, 4, and 5.


