
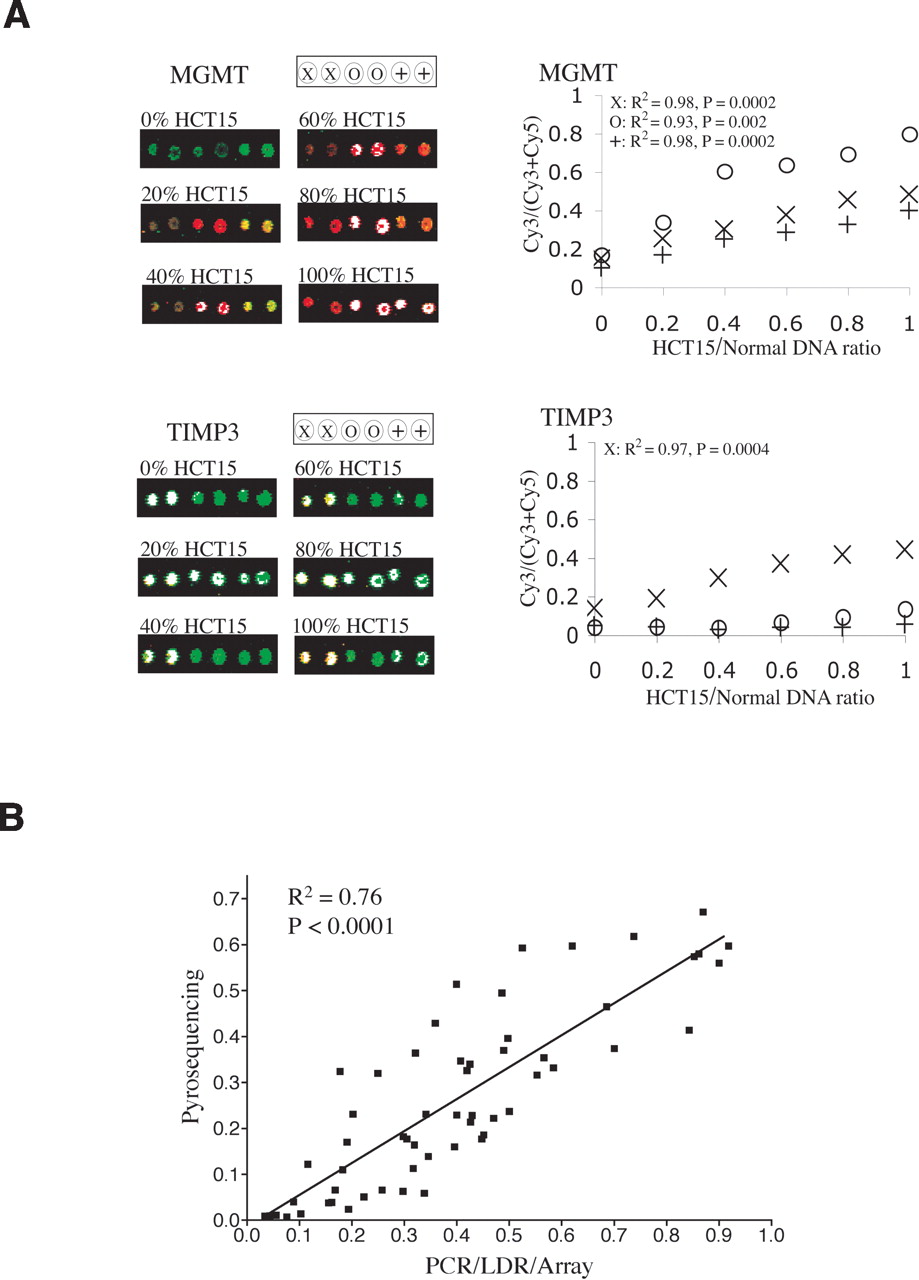
The quantification curves of the assay. Genomic DNAs of HCT15 and normal human lymphocytes were mixed in 0%, 20%, 40%, 60%, 80%, and 100% ratios and subjected to bisulfite-PCR/LDR/Universal Array analysis. (A) Representative array images are shown scanned in both Cy3 and Cy5 channels. False color red (Cy3) and green (Cy5) represent the methylated and unmethylated alleles of CpG dinucleotides, respectively. Color composites of the two channels reflect the methylation levels. Each zip-code was double-spotted on the array to ensure fabrication quality. MGMT and TIMP3 were used as examples to show the assay linearity measured at individual CpG dinucleotides. The plotted value at y-axis represents the fluorescence intensity Cy3/(Cy3 + Cy5) ratio. The value at x-axis represents the percentage of HCT15 mixed with normal human lymphocyte genomic DNAs. The R2 and P-values of each linear regression line were calculated, although the lines were omitted in the plots for visual clarity. Nearly no methylation was observed at two of the CpG sites of TIMP3 resulting in poor statistical correlation (circles: R2 = 0.81, P = 0.02; crosses: R2 = 0.08, P = 0.01). The experiments were repeated three times with different sample preparations and array hybridizations. The PCR and LDR primer sequences and their concentrations used in these experiments are listed in Supplemental Tables 3 and 4. (B) Comparison of the MGMT methylation level from 15 colorectal carcinomas using pyrosequencing technology and bisulfite/PCR/LDR/Universal Array. Three CpG sites were evaluated per DNA sample. The plotted value at y-axis represents the percentage of methylated cytosines in the tumor samples as obtained from pyrosequencing. The value at x-axis represents the ratio of fluorescence intensities Cy3/(Cy3 + Cy5). The mixed genomic DNAs of HCT15 and normal human lymphocytes shown in A were included as controls.


