
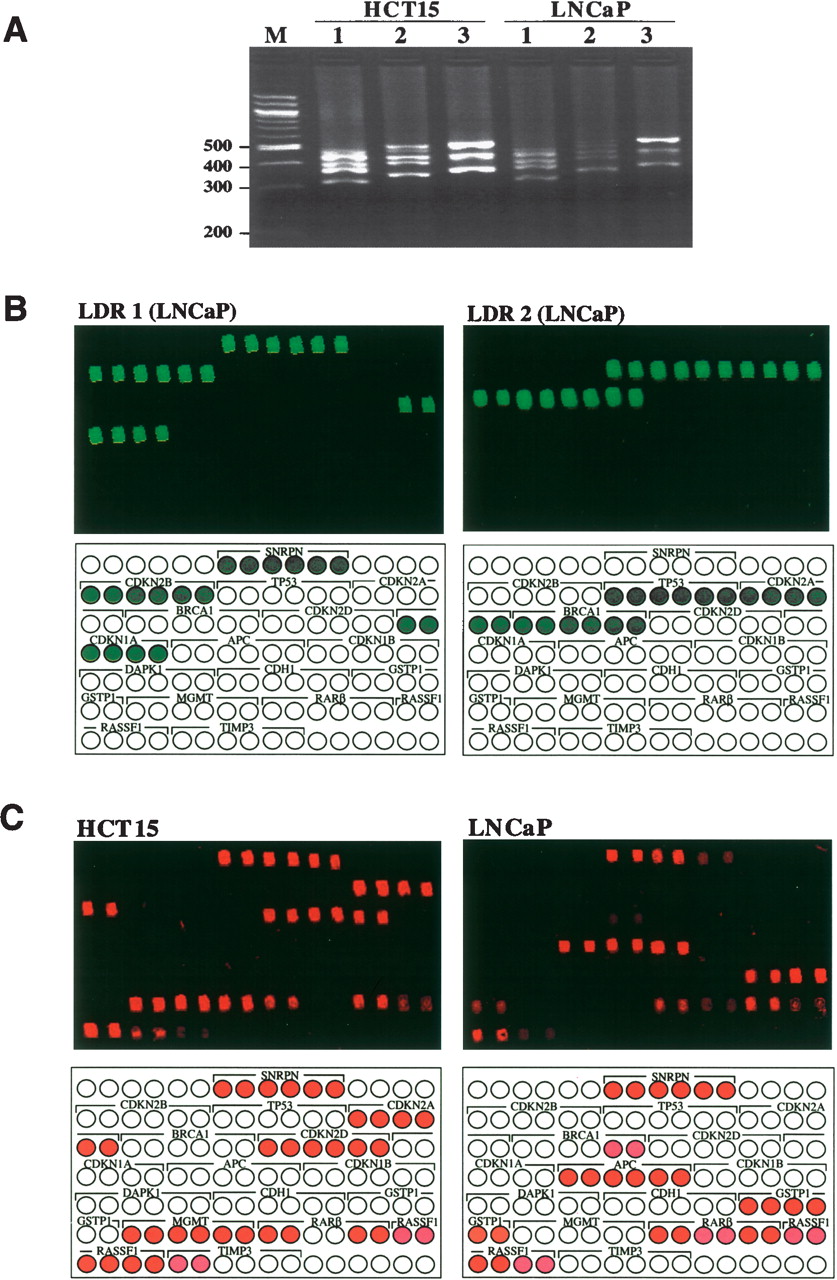
Representative bisulfite-PCR/LDR/Universal Array analysis of 16 promoter regions of cell lines HCT15 and LNCaP. (A) For the ease of demonstration, either five or six promoter regions were amplified in one PCR, and a total of 16 genes were simultaneously analyzed. The gene names and the corresponded PCR fragments are as follows: (lane 1) CDKN2B (317 bp), CDKN2A (363 bp), CDKN1A (391 bp), CDKN1B (426 bp), SNRPN (442 bp), and BRCA1 (459 bp); (lane 2) CDKN2D (346 bp), TIMP3 (404 bp), APC (433 bp), RASSF1 (474 bp), and CDH1 (513 bp); and (lane 3) MGMT (362 bp), TP53 (418 bp), DAPK1 (434 bp), GSTP1 (507 bp), and RARB (522 bp). (B) LDR/Universal Array analysis of the unmethylated cytosines in LNCaP amplicons. All PCR products were pooled as LDR templates, but only selected LDR primers were used in each reaction (LDR set1: SNRPN, CDKN2B, CDKN1A; LDR set2: CDKN2A, TP53, BRCA1). The subset of promoter regions that were interrogated in each LDR are depicted in the diagram (green circles) under each array image. The Cy5-labeled LDR products (false color green, designed for unmethylated cytosines) were captured on Universal Arrays. (C) All PCR products of each sample were pooled and subjected to LDR/Universal Array assay. Only Cy3-labeled LDR primers (false color red) were used in this assay to detect methylated cytosines. The diagram under each array image depicts the correlated zip-codes (circles) that were assigned to represent the CpG methylation status in each of the 16 promoter regions. Each zip-code was double-spotted on the array to ensure fabrication quality. Red and empty circles represent methylated and unmethylated CpG sites, respectively. Pink circles represent those CpG dinucleotides that have lower level of methylation. The PCR and LDR primer sequences and their concentrations used in these experiments were listed in the Supplemental Tables 1, 2, and 3.


