
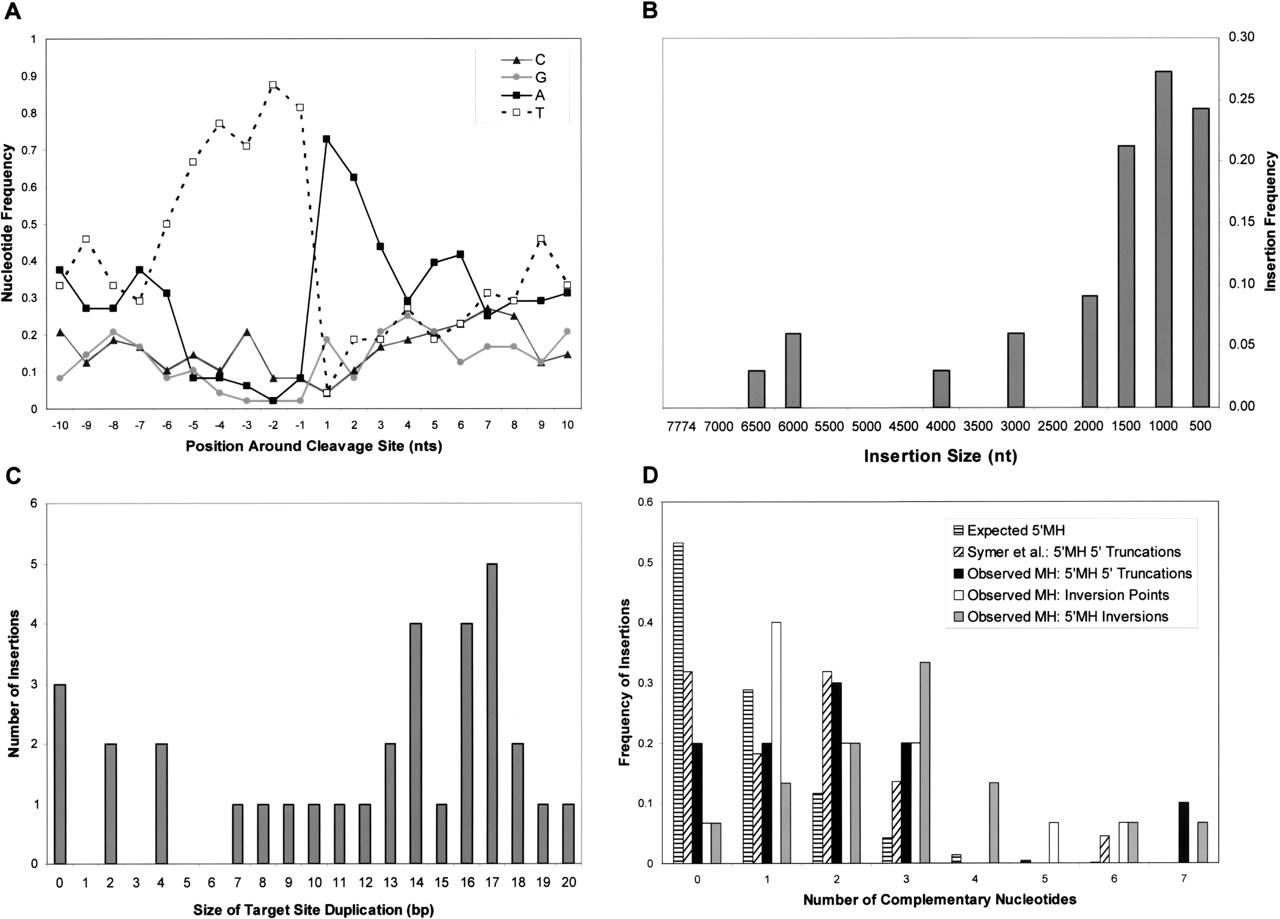
Characteristic features of L1 retrotransposition in de novo integrants. (A) Average frequencies of each base in the 10 nt surrounding the insertion sites of de novo inserts. (B) Insertion length distribution of 33 fully characterized integrants. Lengths of the inverted inserts were calculated by adding the lengths of inverted and direct segments. (C) The distribution of TSD lengths among 33 fully characterized inserts. (D) Observed microhomology (MH) frequencies at 5′ boundaries of noninverted 5′-truncated insertions (black), and at the inversion points (white) and 5′ boundaries (gray) of insertions containing inversions. Observed 5′MH frequencies were in agreement with those in cultured cells (Symer et al. 2002) (diagonal stripes), and were higher than expected for random ligation (Roth et al. 1985) using both the random nucleotide distribution (data not shown) and the nucleotide distribution in the 30-bp downstream of the insertion site (horizontal stripes).


