
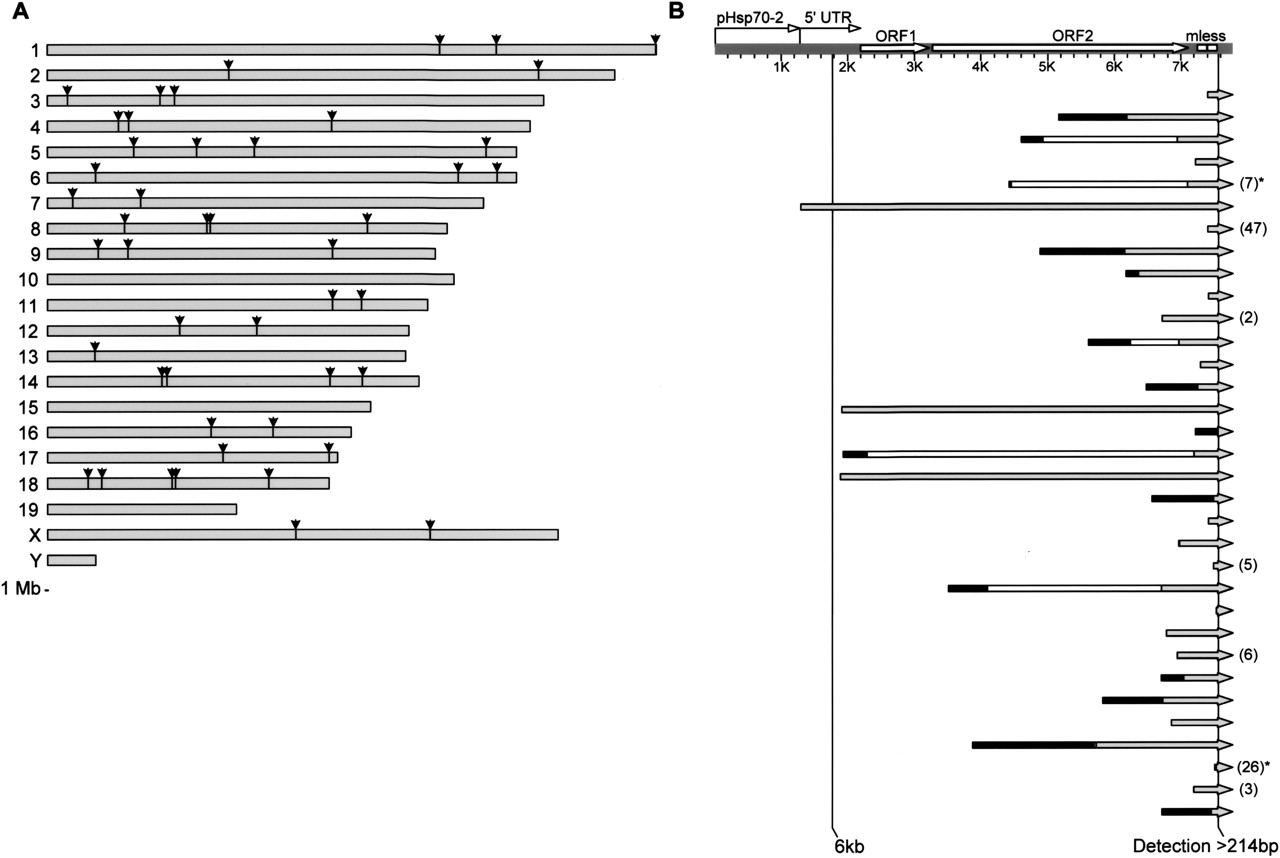
Genomic distribution and structural features of de novo insertions. (A) Using TAIL–PCR, 51 de novo integration sites were determined, 48 of which were uniquely mapped to the mm6 assembly of the mouse genome. Depicted are the locations of 47 inserts (one mapped to an unplaced location and is not shown). 1-Mb scale reference is shown at the bottom. (B) The structures of 33 fully characterized de novo inserts. A hypothetical full-length (FL) insert is shown at the top, with vertical lines indicating the 6-kb endogenous FL element and the 214-bp detection limit in our study. De novo integrants are shown on separate lines, aligned to the FL element. (Direct fragment) Gray rightward arrow; (inverted fragment) black rectangle; (deletion of sequence in inverted elements) white rectangle; (extra 5′ nt) numbers in parentheses; (dual inversions) asterisk. Three elements mobilized ∼6 kb of sequence, one is FL and two are nearly FL.


