
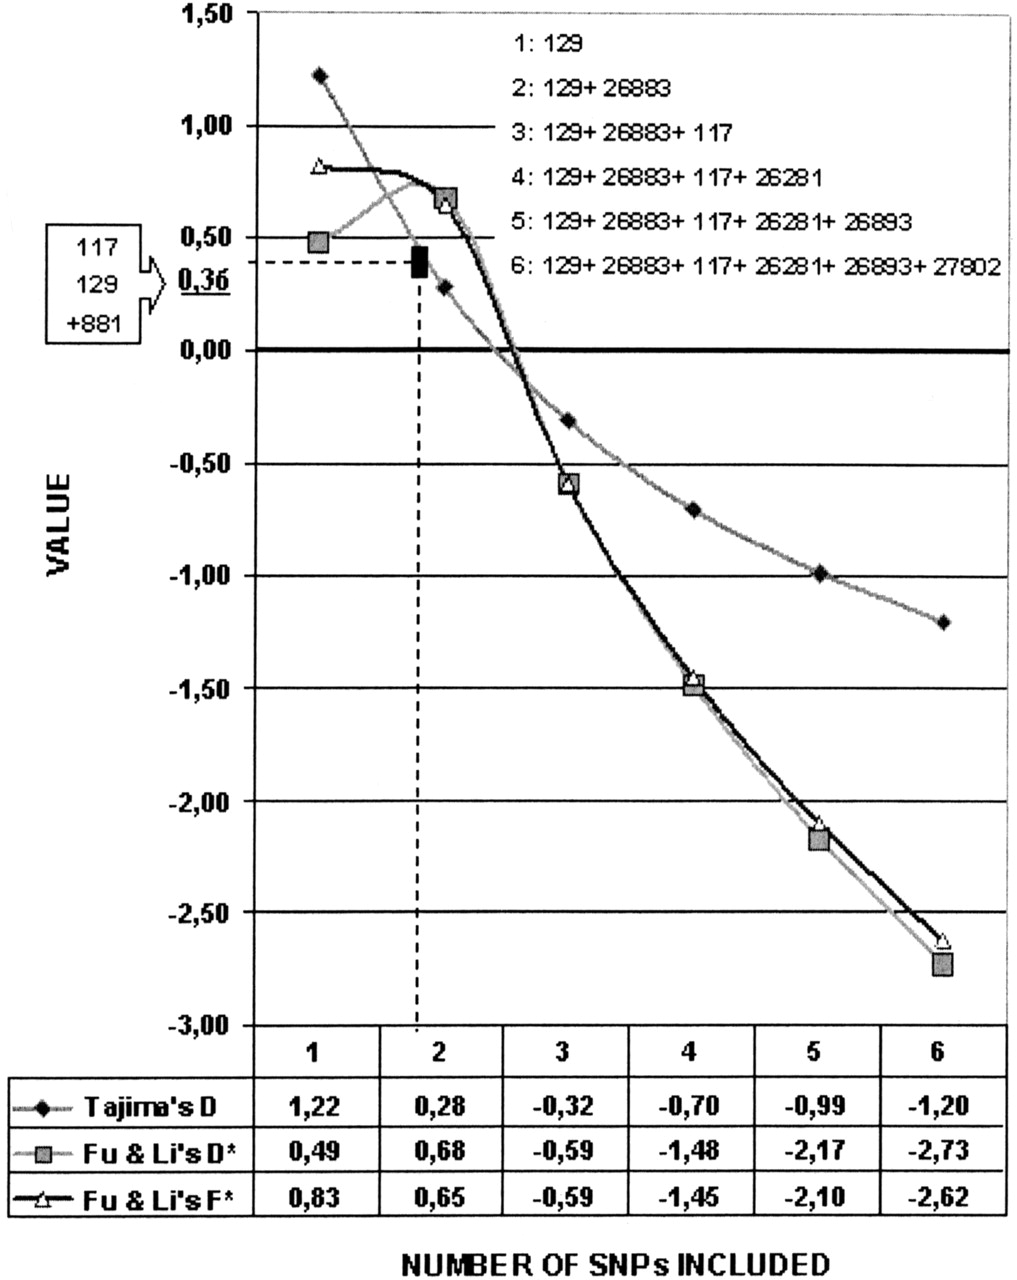
Selection tests versus number of SNPs included in the study of Europe. We calculated the three neutrality statistics, starting with the most frequent polymorphic position (1, codon 129) and adding the remaining positions one by one in decreasing order of allele frequency, with the final calculations performed on the full set of SNPs. Comparison with a previous study is shown as a dashed line (for a D-value of 0.36). On the upper right corner are the SNPs included in this study (six). In the upper left box, the three SNPs found in a previous study by Mead et al. (2001, 2003) in the same genome region are shown. Only codons 129 and 117 are common in both studies.


