
Figure 2.
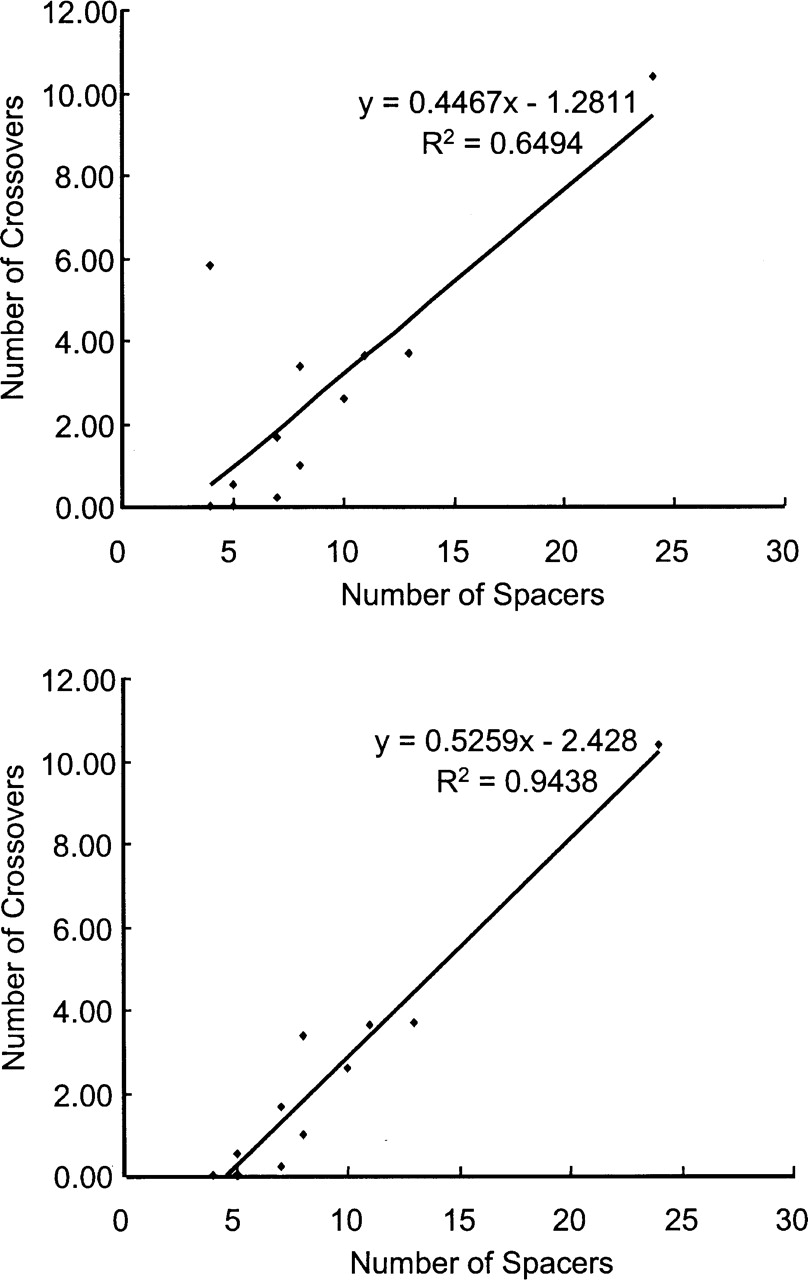
Correlation between the number of crossovers and the number of spacers in the 13 areas, A1-A13. (Top) Plot including A2; (bottom) plot excluding A2 from the correlation analysis.
(Downloading may take up to 30 seconds. If the slide opens in your browser, select File -> Save As to save it.)
Click on image to view larger version.
Correlation between the number of crossovers and the number of spacers in the 13 areas, A1-A13. (Top) Plot including A2; (bottom) plot excluding A2 from the correlation analysis.
 CiteULike
 Delicious
 Digg
Digg Facebook
 Google+
 Reddit
 Twitter
