
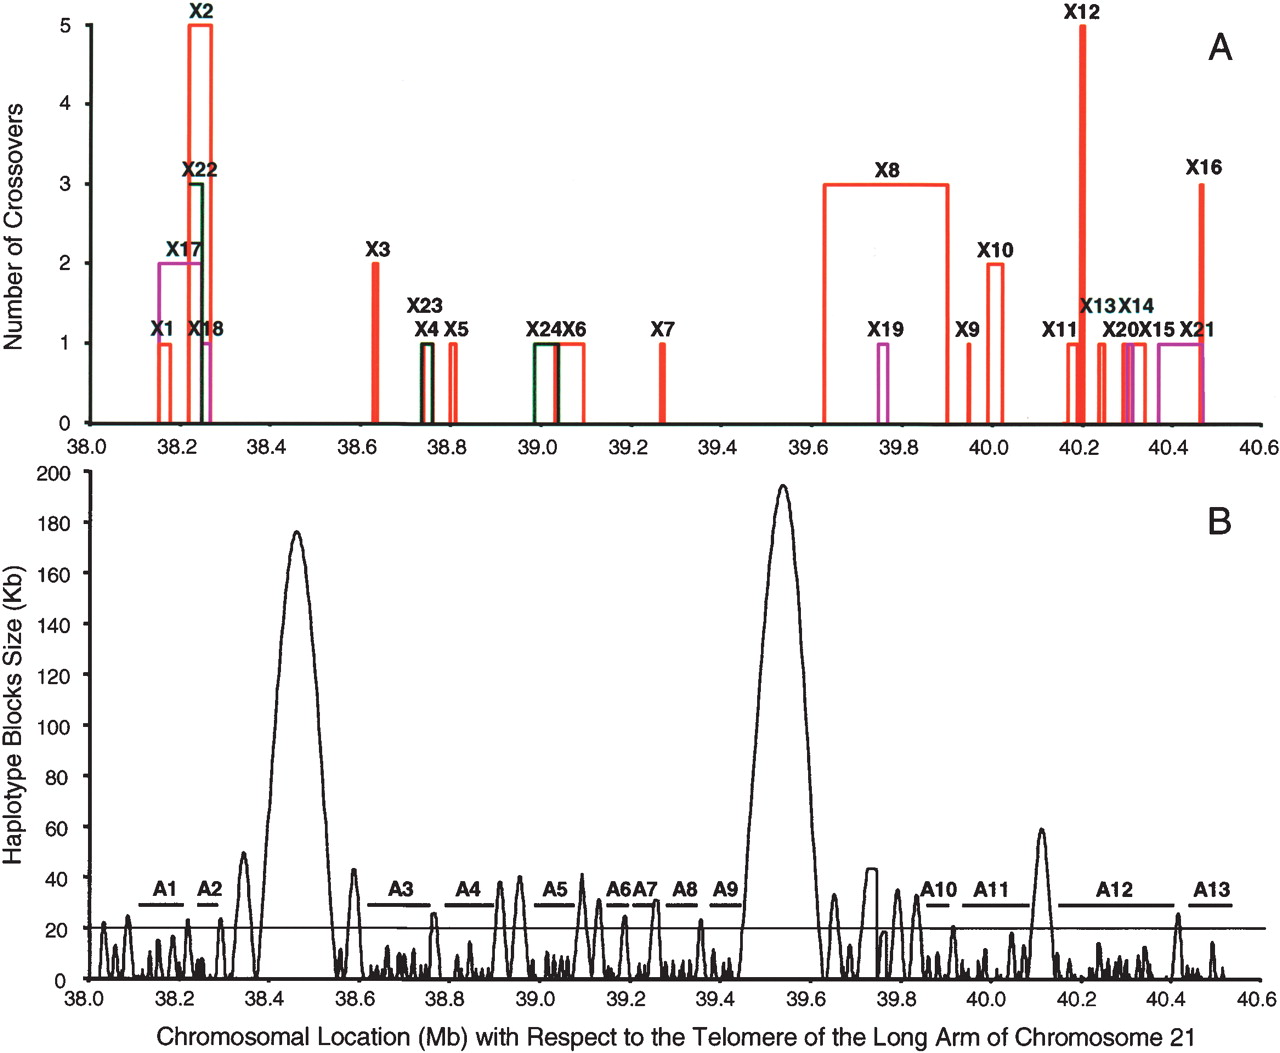
Schematic physical correlation between locations of crossovers and haplotype blocks in the 2.5-Mb region. (A) Distribution of recombination crossovers. Regions in which crossovers were identified are indicated as rectangles and labeled with an “X” and a number. The width of a rectangle shows the areas between informative markers, and height indicates the number of crossovers identified. Crossovers identified from individuals D-11, D-12, and D-8 are red, pink, and green, respectively. (B) Haplotype blocks and Areas A1-A13, containing only small blocks and spacers within the region. Haplotype blocks are peaks in dark blue with their bottoms indicating their locations and spanning areas. Areas with spacers in clusters are marked with horizontal bars and indicated with a letter “A” and a number.


