
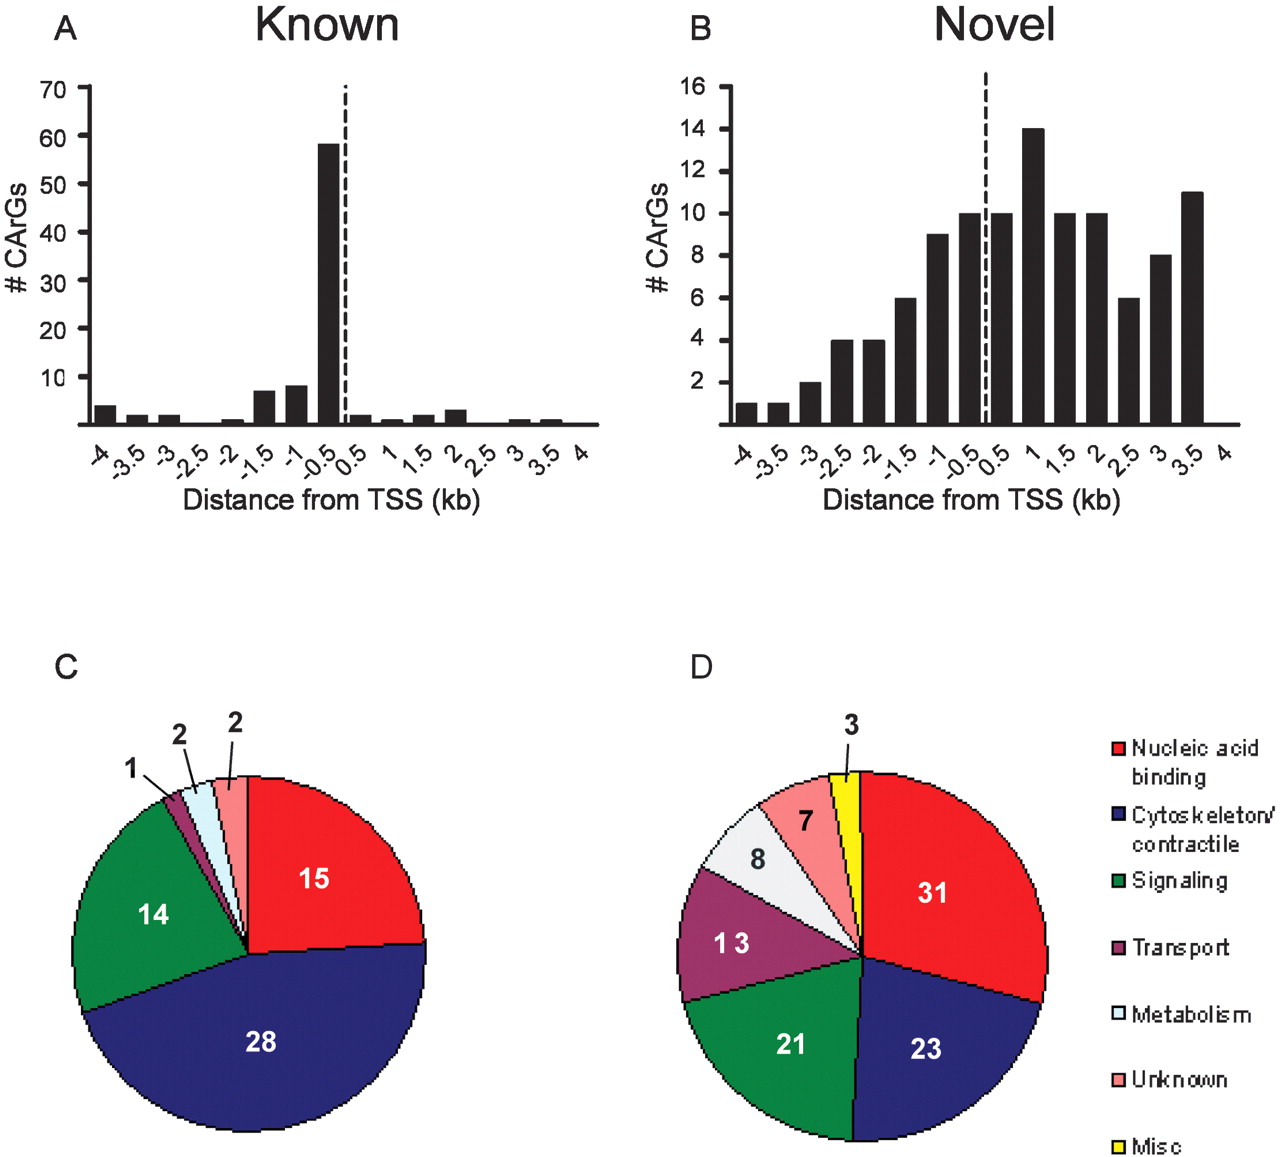
Figure 2.
Features of novel CArG-containing genes. Comparison of (A,C) known and (B,D) computationally predicted CArG elements and corresponding genes with respect to distance from TSS (A vs. B) and GO annotation (C vs. D), respectively. Note broad distribution of predicted CArG elements around the TSS (B) as compared to known CArG boxes (A). Dotted vertical lines in A and B indicate the TSS.


