
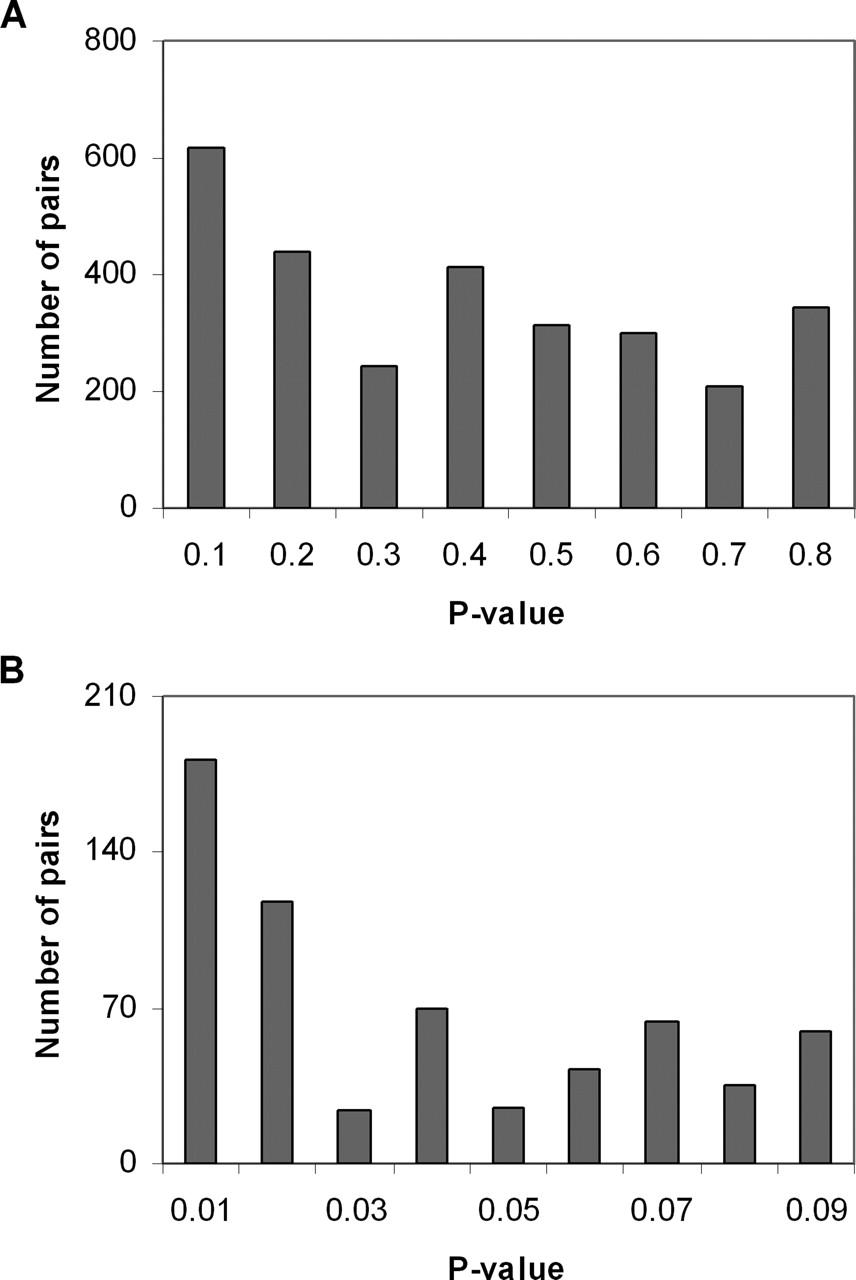
Figure 7.
The P-value distribution of all duplicate pairs for asymmetric AS evolution after gene duplication, which was calculated by the binomial test under the null hypothesis of no difference in the number of AS forms (see Methods). (A) represents all duplicate pairs; (B) represents duplicate pairs having P-value <0.1.


