
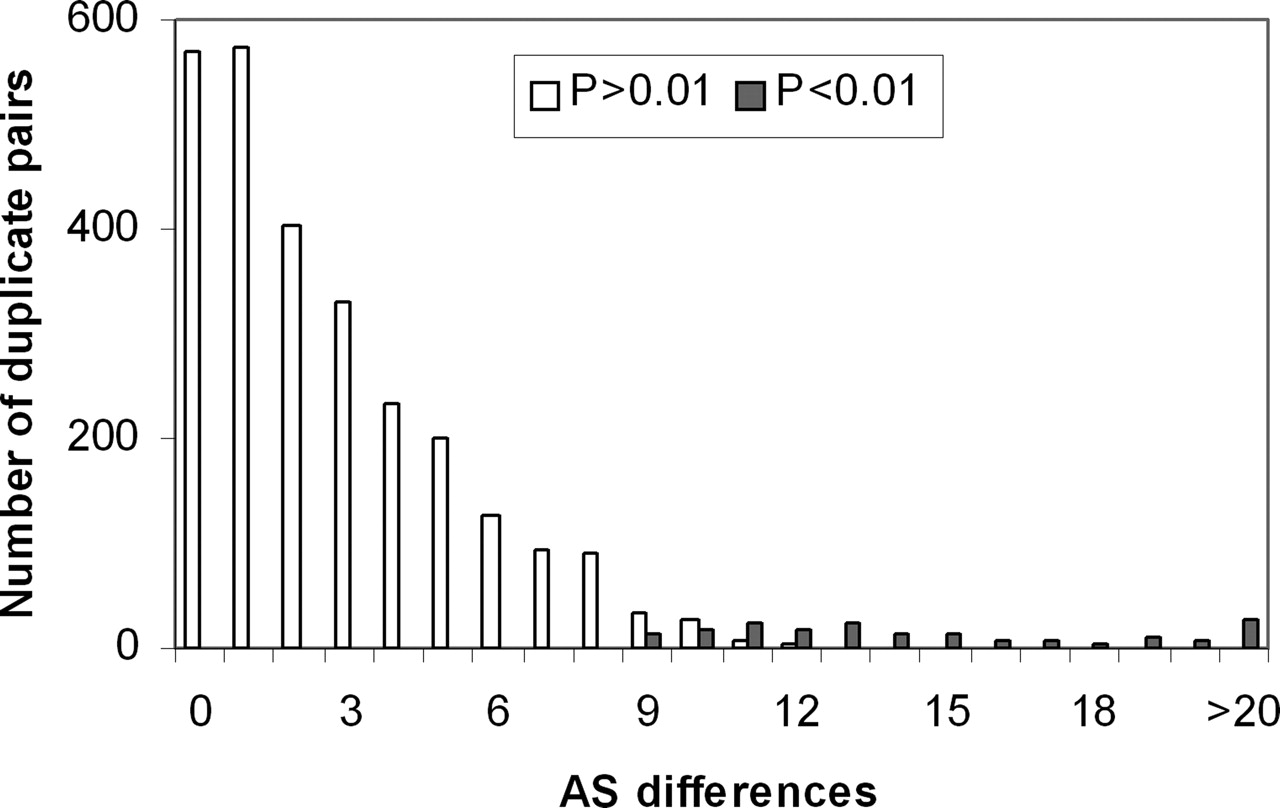
Figure 6.
The distribution of the number of AS form differences in all duplicate pairs. P-values for asymmetric AS evolution between duplicates <0.01 (black bars) and >0.01 (white bars) are shown.
(Downloading may take up to 30 seconds. If the slide opens in your browser, select File -> Save As to save it.)
Click on image to view larger version.
The distribution of the number of AS form differences in all duplicate pairs. P-values for asymmetric AS evolution between duplicates <0.01 (black bars) and >0.01 (white bars) are shown.
 CiteULike
 Delicious
 Digg
Digg Facebook
 Google+
 Reddit
 Twitter
