
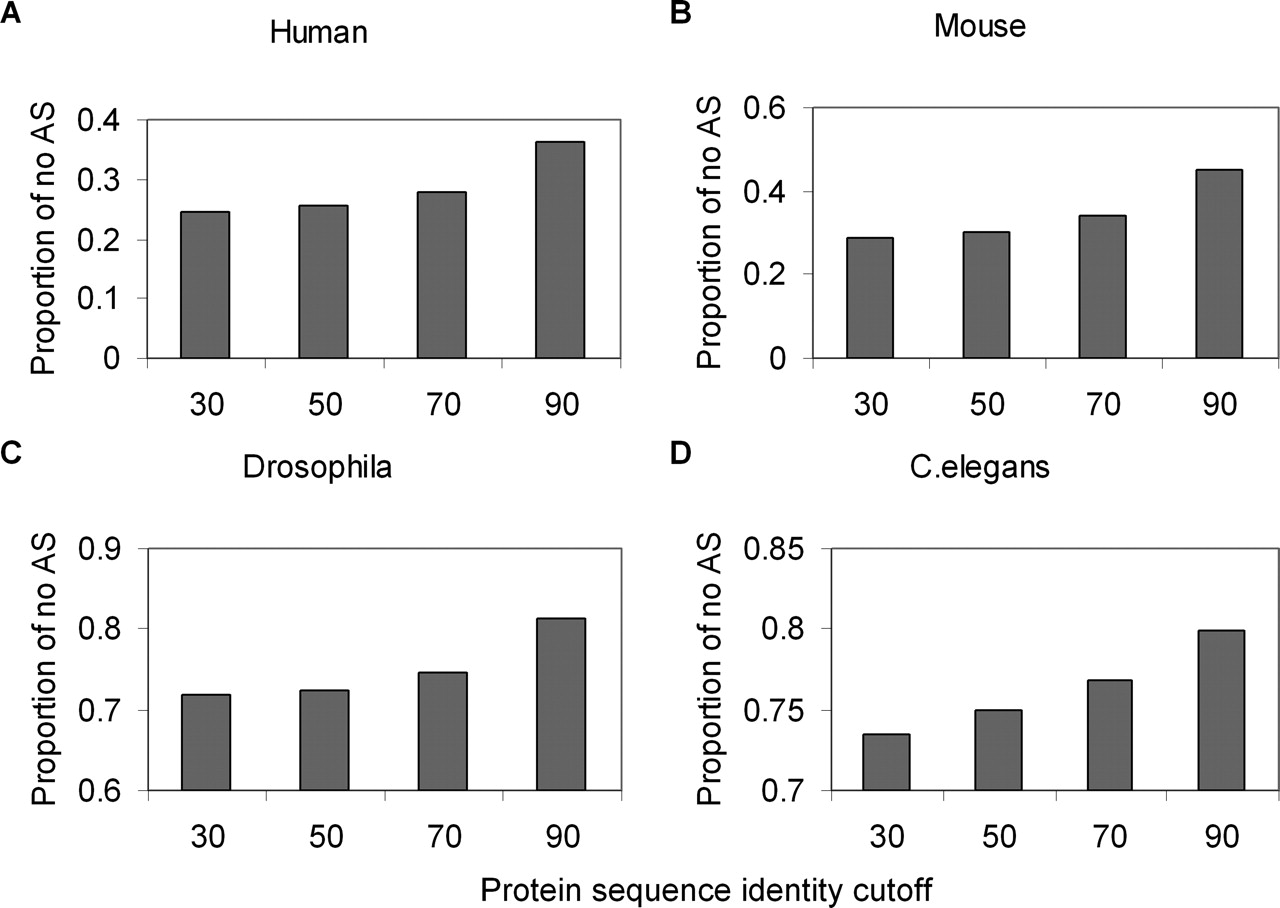
Figure 5.
Recent duplicated genes are unlikely to be alternatively spliced (A-D). Each bar represents the proportion of genes that is not alternatively spliced in four model organisms. Genes having the sequence identity >30% and E-value <1E-10 were classified to the group 30. Similarly, the groups 50, 70, and 90 were under the identity cutoff 50%, 70%, and 90% respectively.


