
Figure 4.
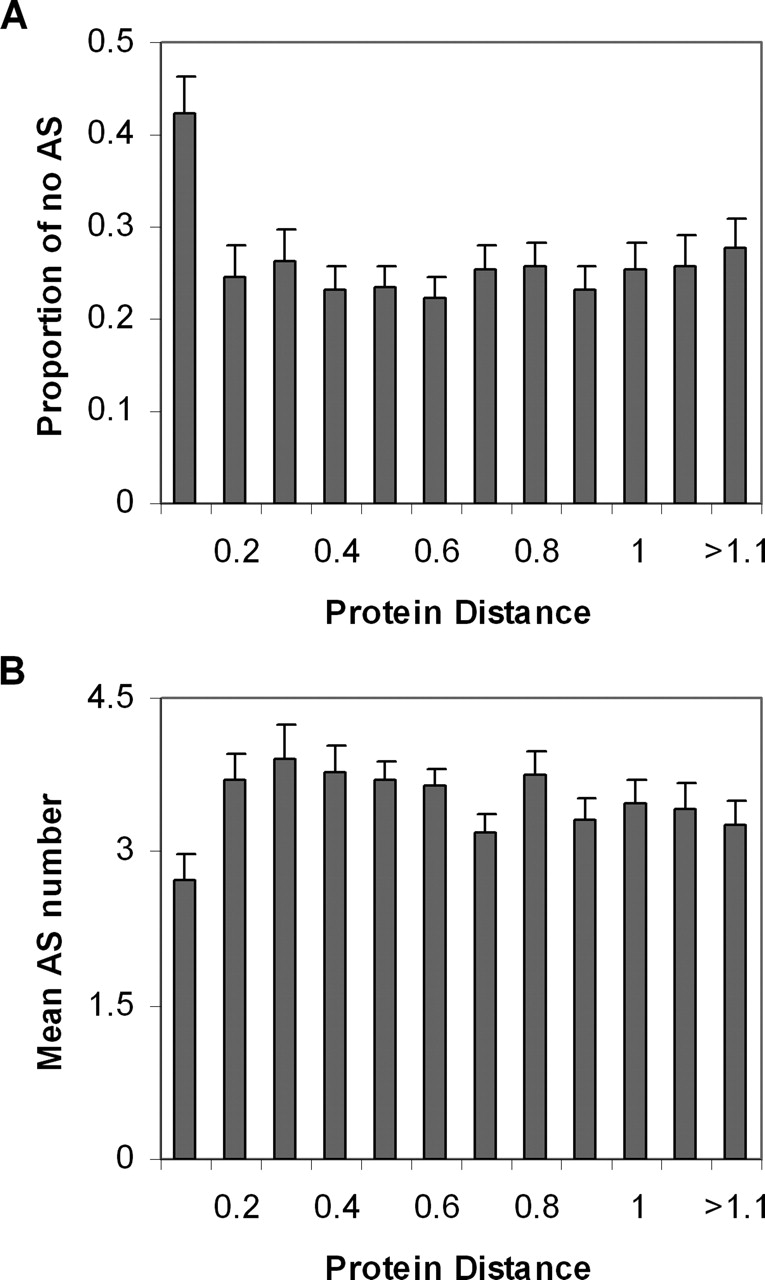
The proportion of no alternatively spliced (no-AS) genes (A) and the mean of AS forms (B) plotted against the protein distance between duplicates (with a bin of 0.1 distance unit). Error bar, standard error.
(Downloading may take up to 30 seconds. If the slide opens in your browser, select File -> Save As to save it.)
Click on image to view larger version.
The proportion of no alternatively spliced (no-AS) genes (A) and the mean of AS forms (B) plotted against the protein distance between duplicates (with a bin of 0.1 distance unit). Error bar, standard error.
 CiteULike
 Delicious
 Digg
Digg Facebook
 Google+
 Reddit
 Twitter
