
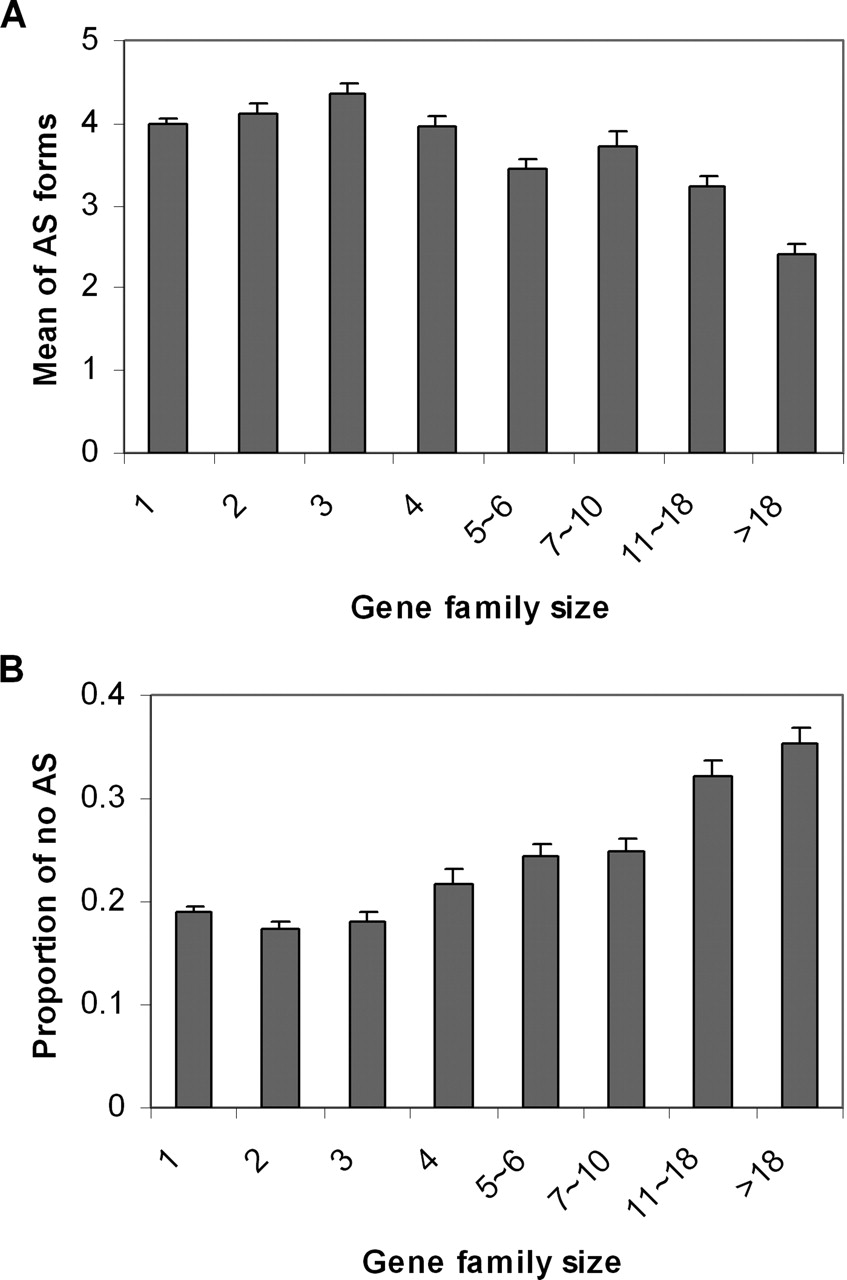
Figure 3.
Fewer AS forms in larger gene families. Error bar, standard error. (A) Mean number of AS forms plotted against human gene family size (size = 1 means single-copy gene). (B) Proportion of genes that are not alternatively spliced plotted against the human gene family size.


