
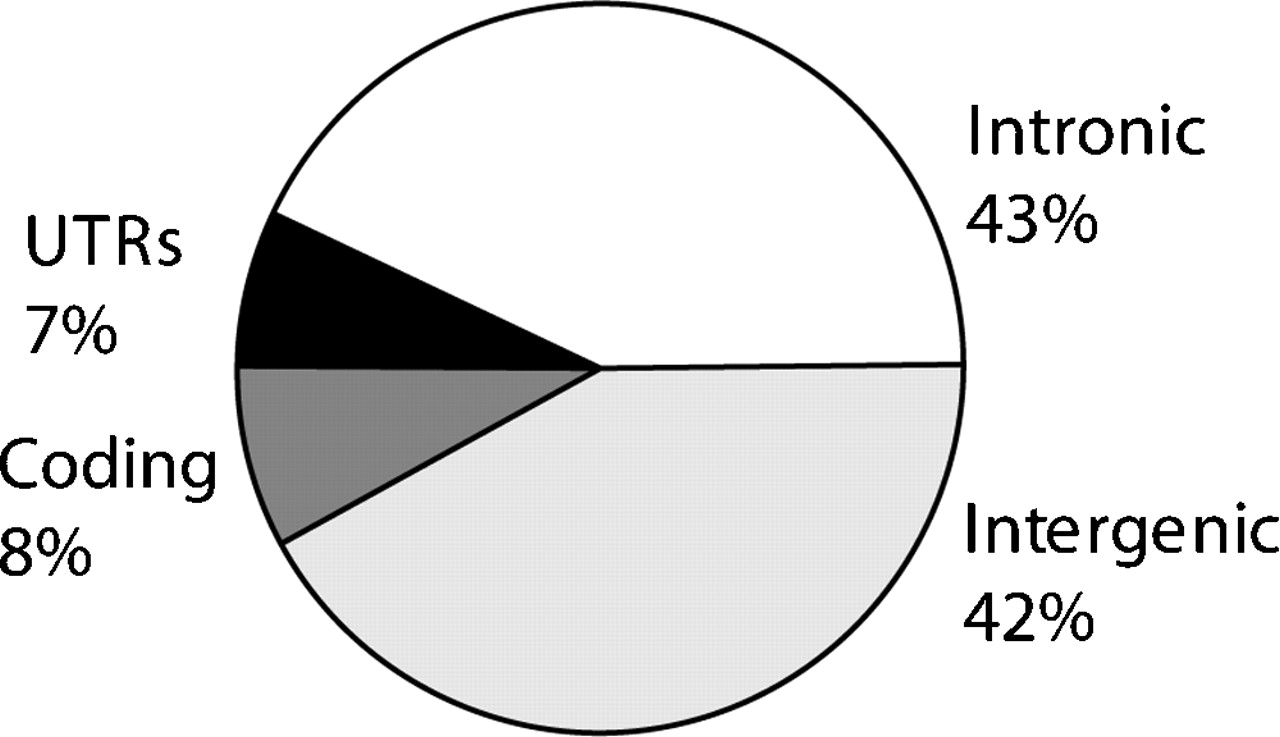
Figure 2.
Breakdown of nucleotide annotations of 12.2 Mb of human TFRs. The pie chart illustrates the fraction of TFR bases that are annotated by the UCSC Known Genes track (Karolchik et al. 2003) as protein coding (coding), 5′ and 3′-untranslated regions (UTR), intronic and intergenic regions.


