
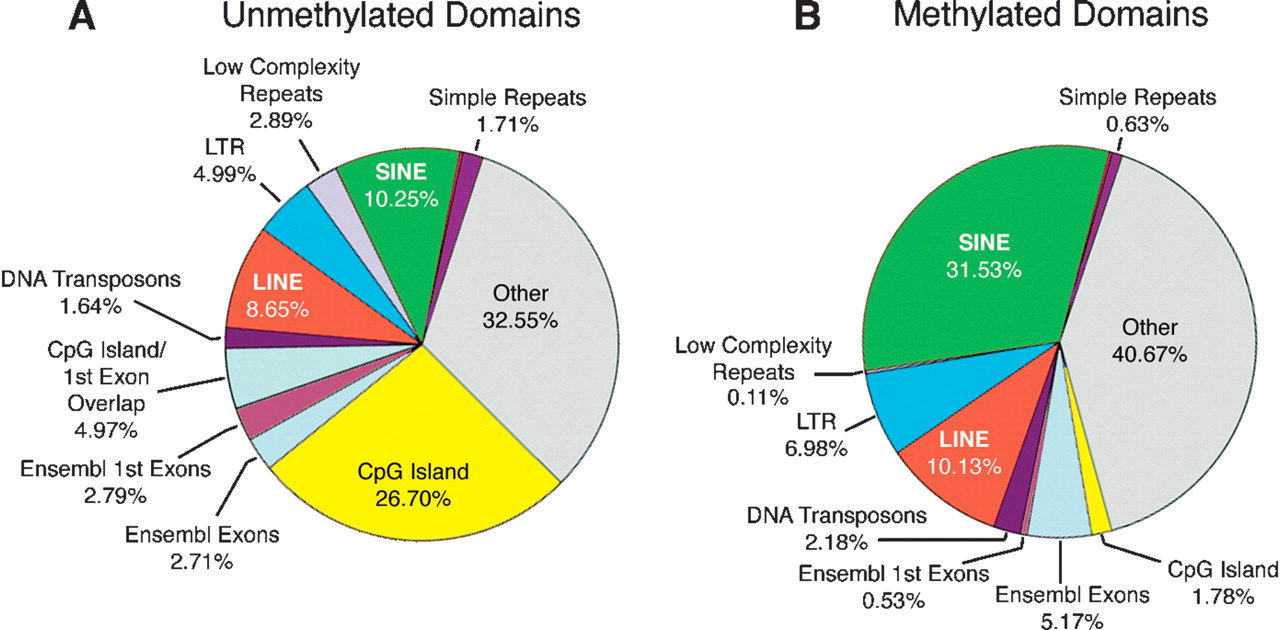
Figure 5.
CpG distributions in unmethylated and methylated domains. All percentages shown were corrected for G+C content and are displayed as observed versus expected values. There is a marked enrichment of CpG island sequences in unmethylated domains (A,B), while the sequence composition of methylated domains resembles that of the genome as a whole, as shown in Figure 1B.


