
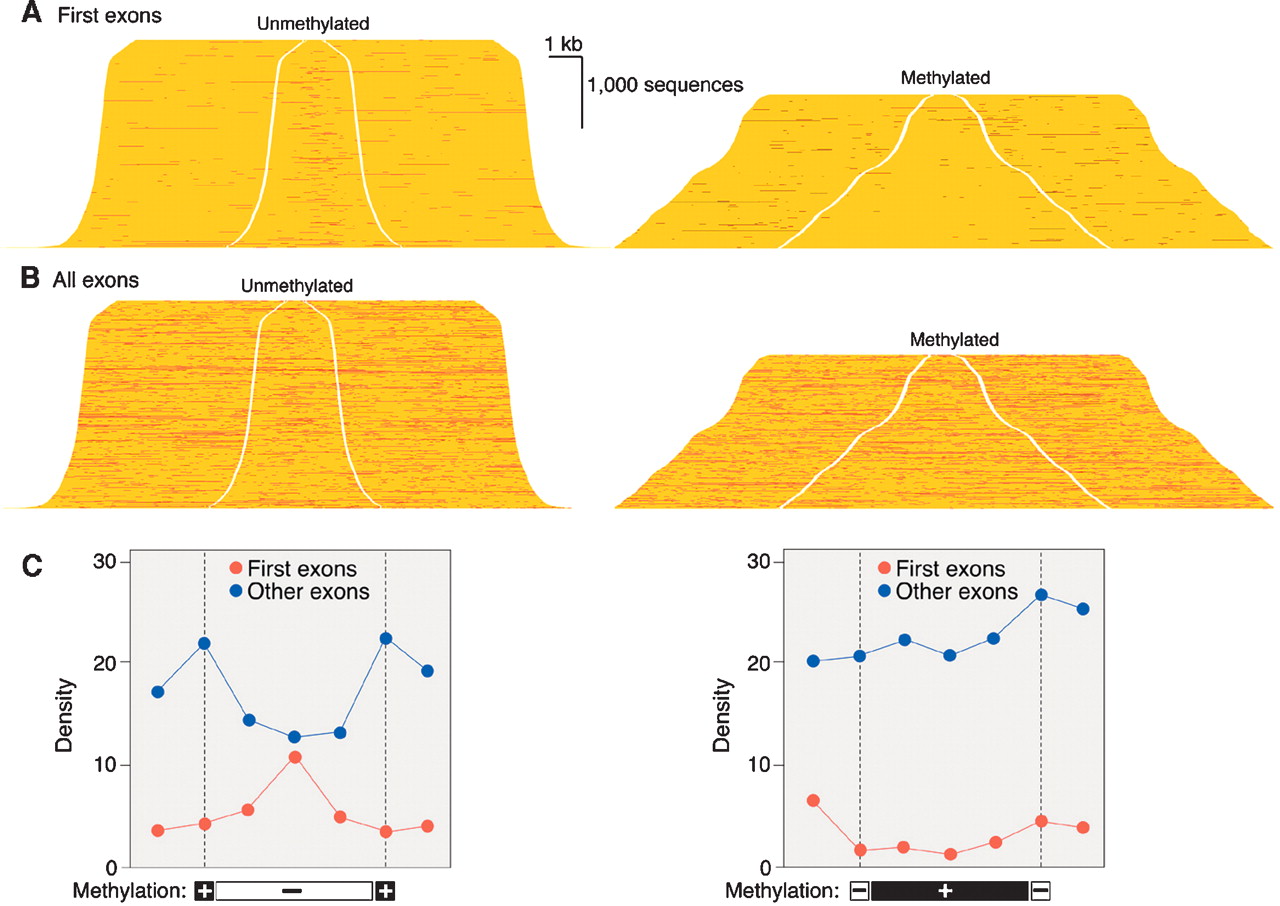
Figure 4.
Frequency of first exons and all exons in methylated and unmethylated domains. (A) First exons displayed as in Figure 3. (B) All exons. (C) Quantitation of A and B as in Figure 3. Exons other than first exons are largely methylated; the peak in unmethylated exons at left is due almost entirely to first exons.


