
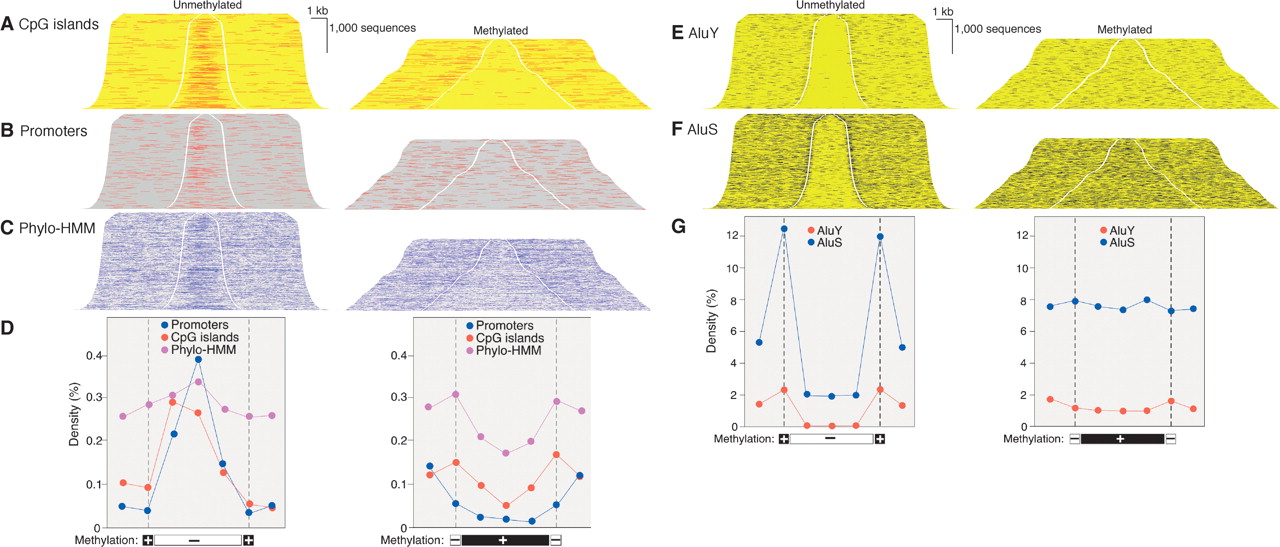
Regulatory sequences and Alu transposons in unmethylated and methylated domains. DNA was fractionated as shown in Figure 2 and cloned into plasmid vectors. BLAT alignment of paired end sequence reads allowed addition of sequence between end reads and of external sequence. Sequences were sorted by insert length and assembled into stacks; the gap indicates position of cleavage by McrBC (left) or RE (right). Genome features annotated at the UCSC genome browser (http://genome.ucsc.edu) were mapped onto sequence stacks in contrasting colors and with a threefold increase in line weight to improve visibility. All sequences shown were associated with a transcript annotated in Ensembl and transcription was from left to right.(A) Enrichment of CpG islands in unmethylated domains and depletion in methylated domains. (B,C) Enrichment in unmethylated domains and depletion in methylated domains of promoters (defined as in Trinklein et al. 2003) and sequences conserved among human, mouse, and rat by phylogenetic Hidden Markov Model analysis (Jojic et al. 2004). (D) Quantitative analysis of data shown in A,B,C. Methylated and unmethylated domains were normalized for length and divided into thirds. Feature density is plotted against the mean of the 5 kb of flanking sequence, at the cleavage site (indicated by broken vertical line) and for each of the three segments of the methylated and unmethylated domains. There were 142,694 CpG sites in the methylated domains and 75,017 in the unmethylated domains; total sequence lengths were 13,795,647 and 8,235,466 bp, respectively. (E,F) Exclusion of AluS and AluY transposons from unmethylated domains. (G) Quantitation of data of E and F as in Figure 1D.


