
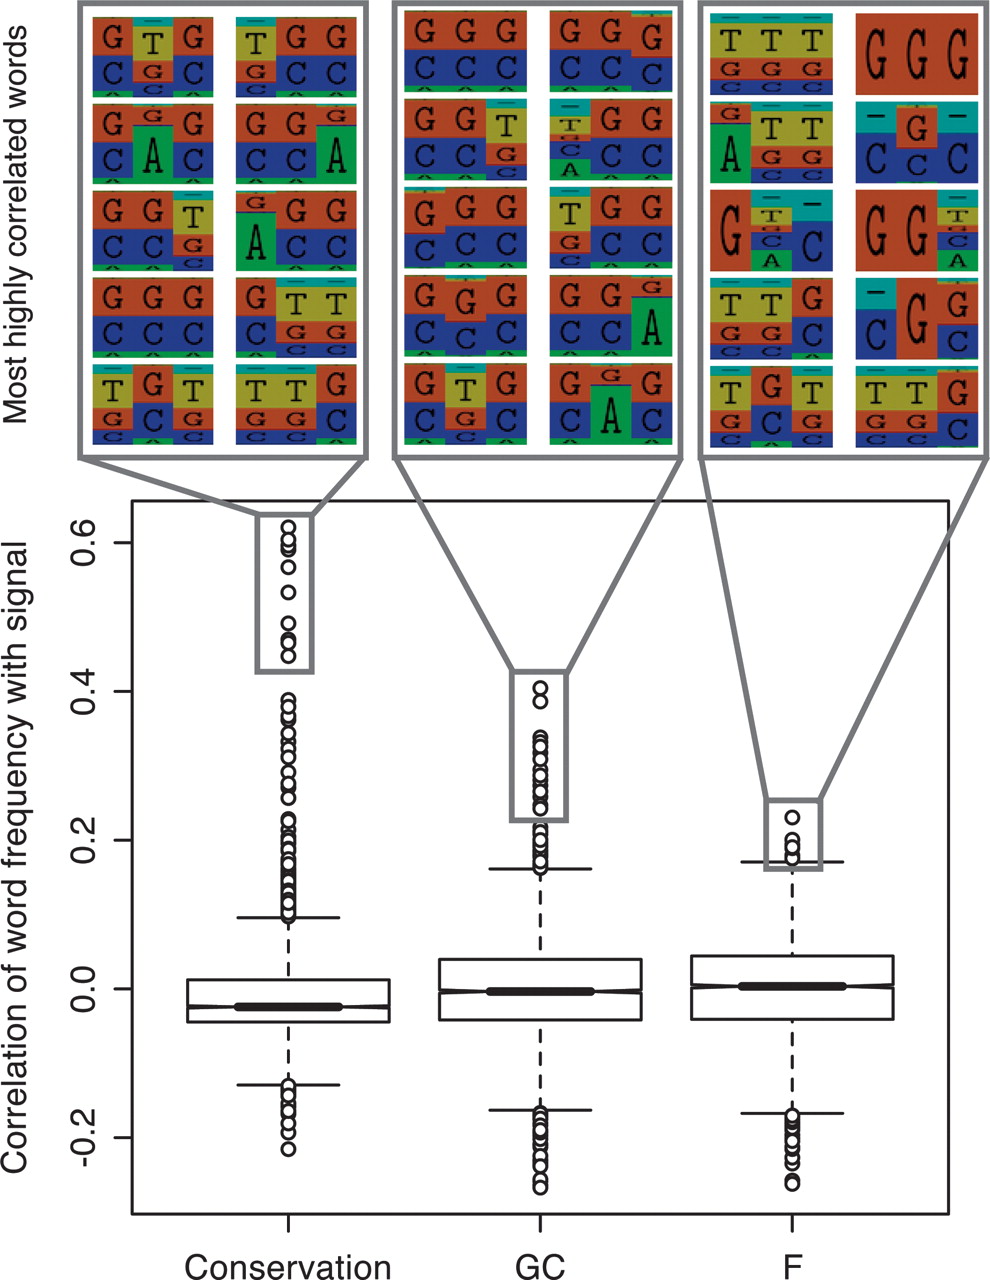
Figure 4.
Distributions of the correlations between word frequencies in the RP training data and three component signals (GC content, conservation, and the residuals F). For each signal, representative logos of the most strongly correlated words are shown. (green, A; yellow, T; red, G; blue, C).


