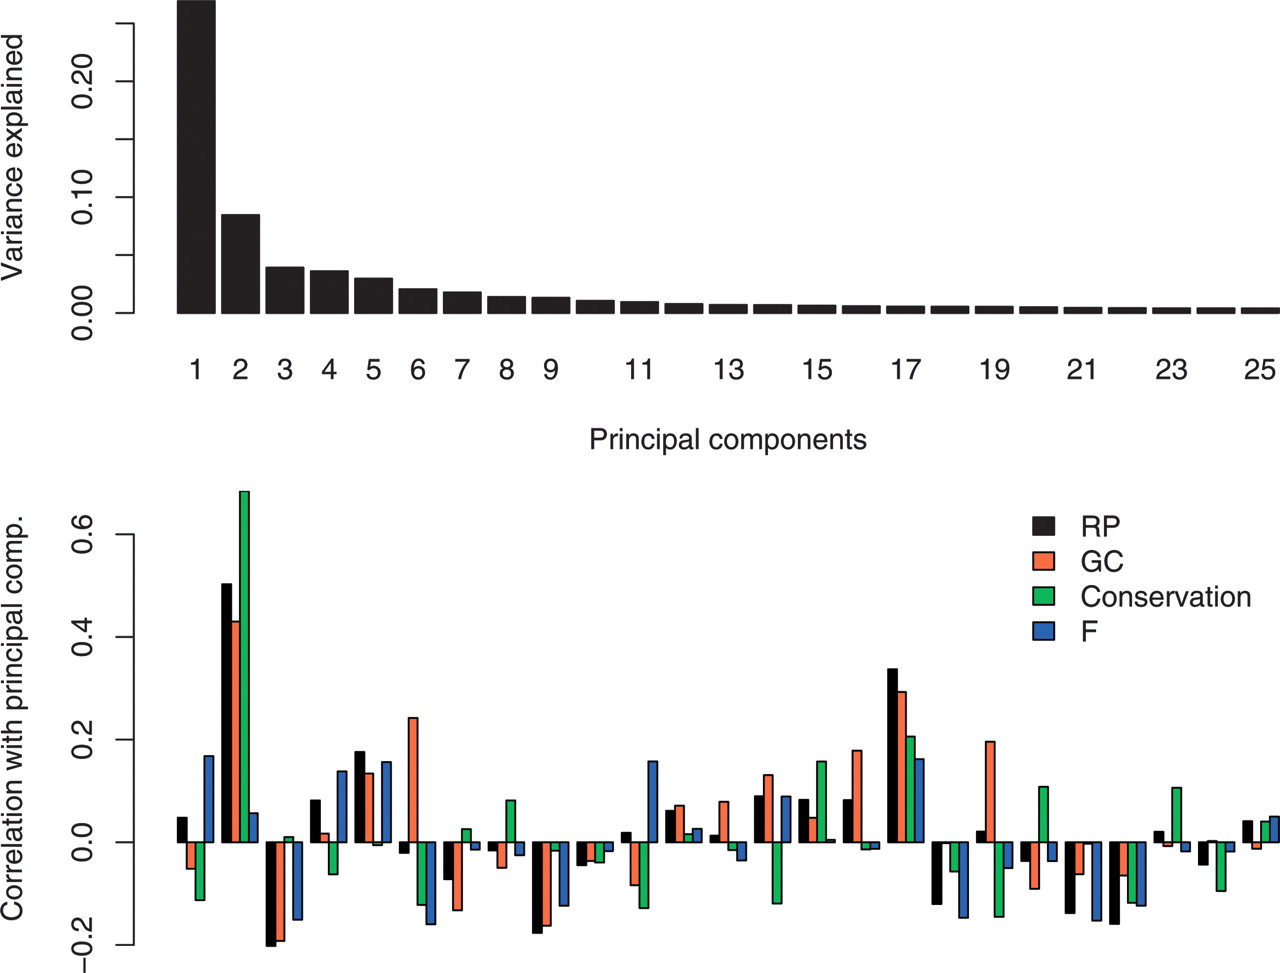
ESPERR: Learning strong and weak signals in genomic sequence alignments to identify functional elements

(Downloading may take up to 30 seconds. If the slide opens in your browser, select File -> Save As to save it.)

Click on image to view larger version.

Figure 3.
Figure 3.

Share of variance explained by each of the first 25 principal components of the RP training data word frequencies (top) and correlation of RP score, GC content, conservation, and the residuals F with each principal component (bottom).

This Article

  1. Genome Res. 16: 1596-1604

Preprint Server