
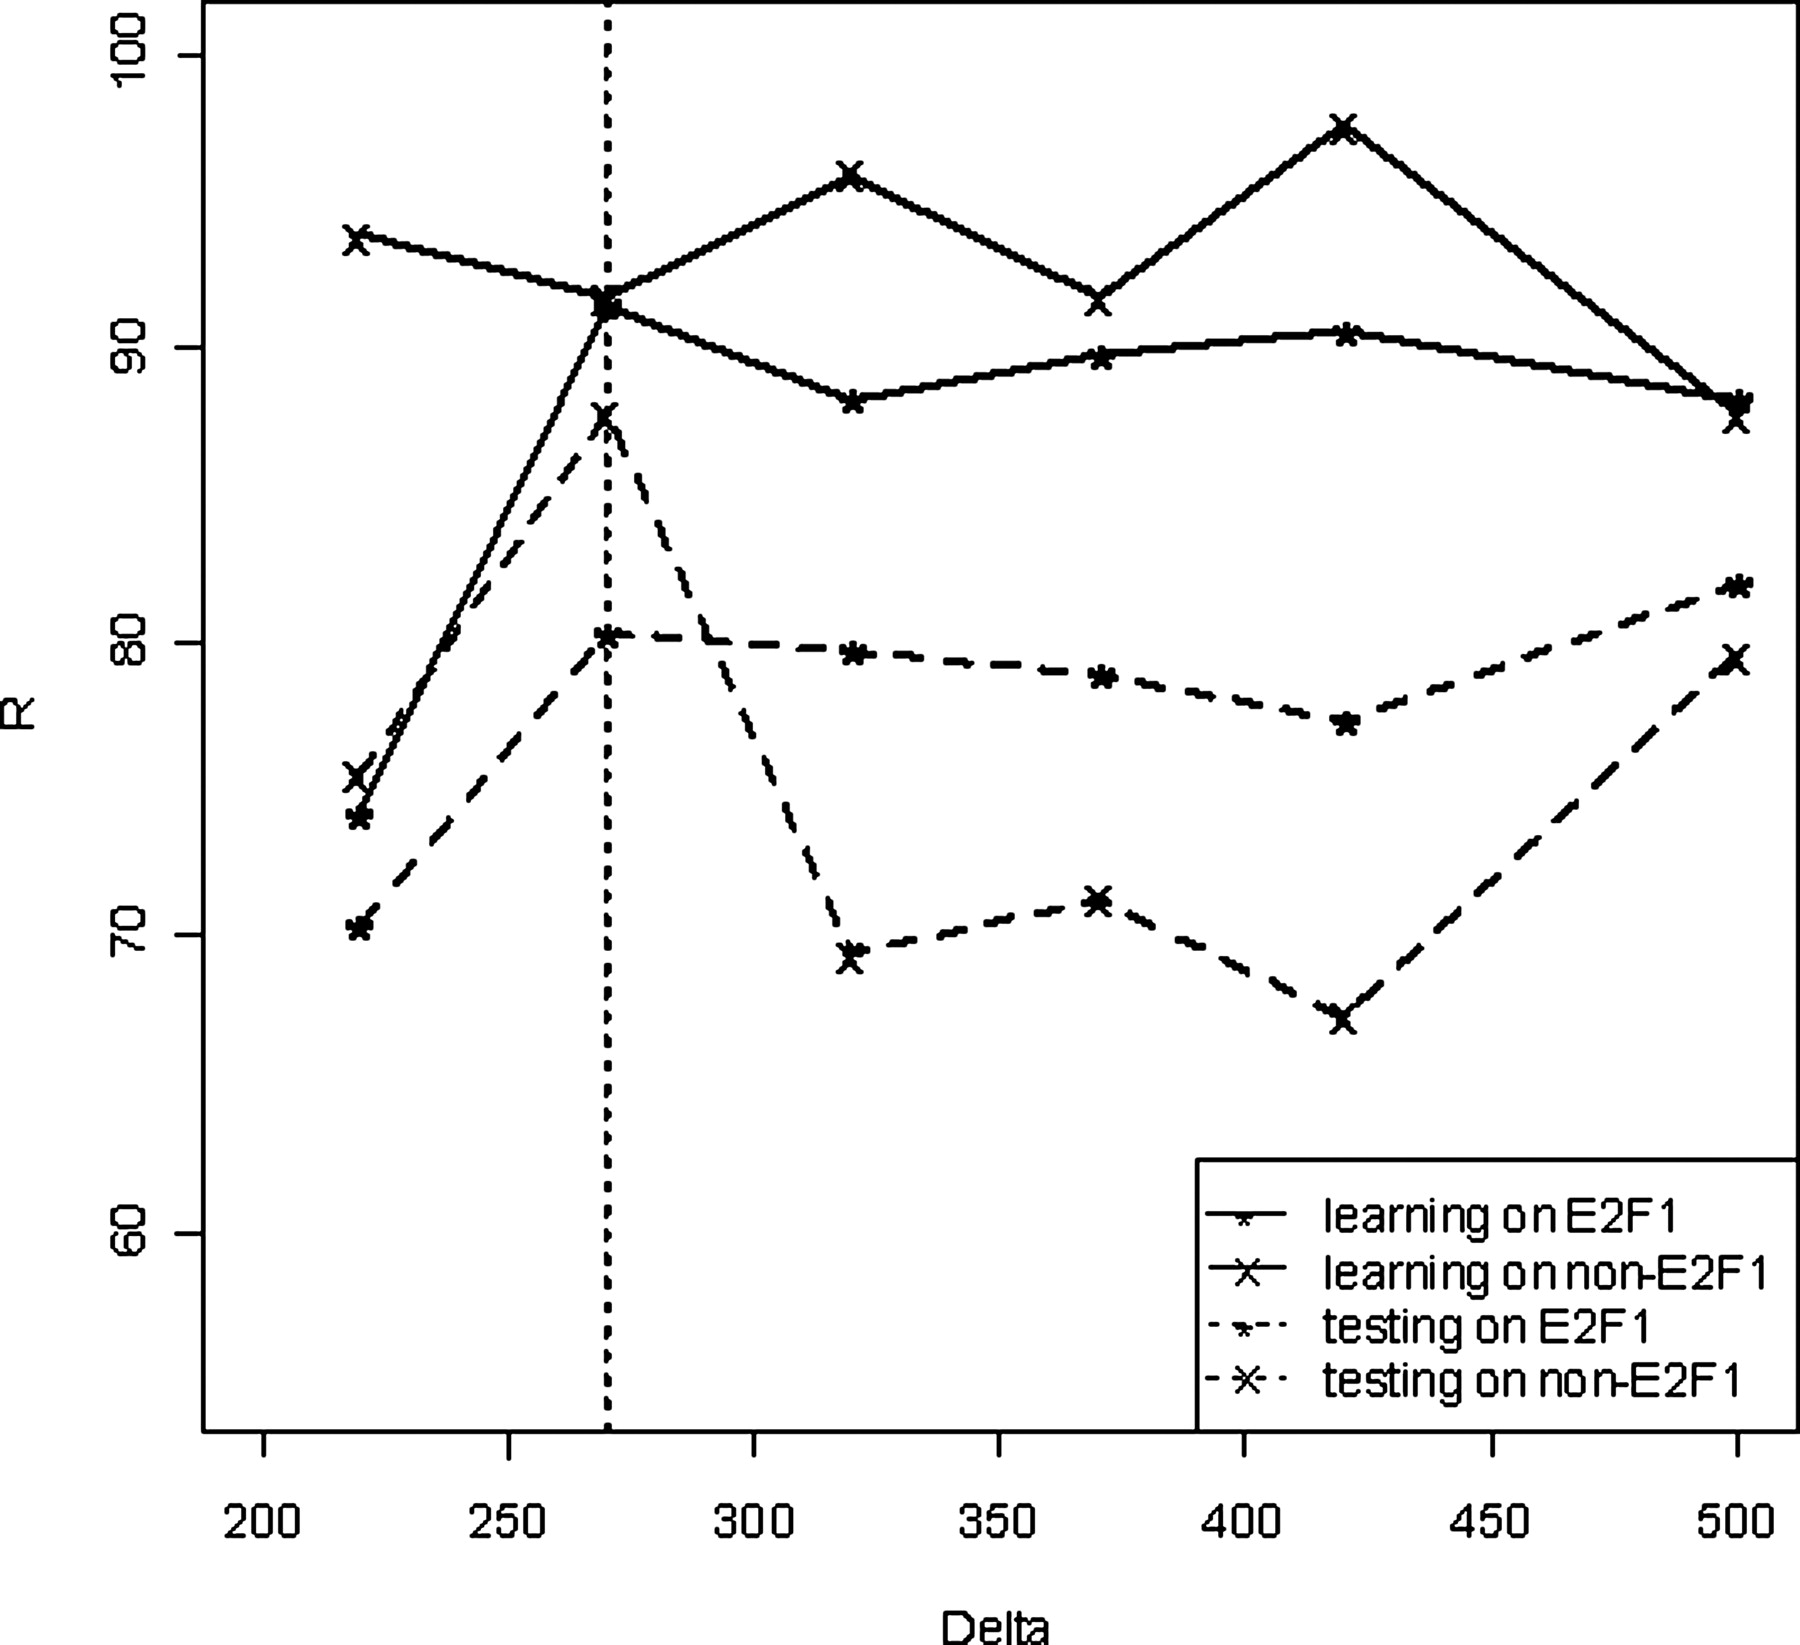
Figure 3.
A graphical representation of the prediction rate (R) vs. Δ values (obtained from the CART results) for different groups of data. (Solid “*” line) Data for E2F1 on training data; (solid “x” line) data for non-E2F1 on training data; (broken “*” line) data for E2F1 on testing data after 10-fold cross validation; (broken “x” line) data for non-E2F1 on testing data after 10-fold cross validation. At a Δ of 270 bp, the prediction rates for E2F1 and non-E2F1 targets on both training and testing samples perform the best.


