
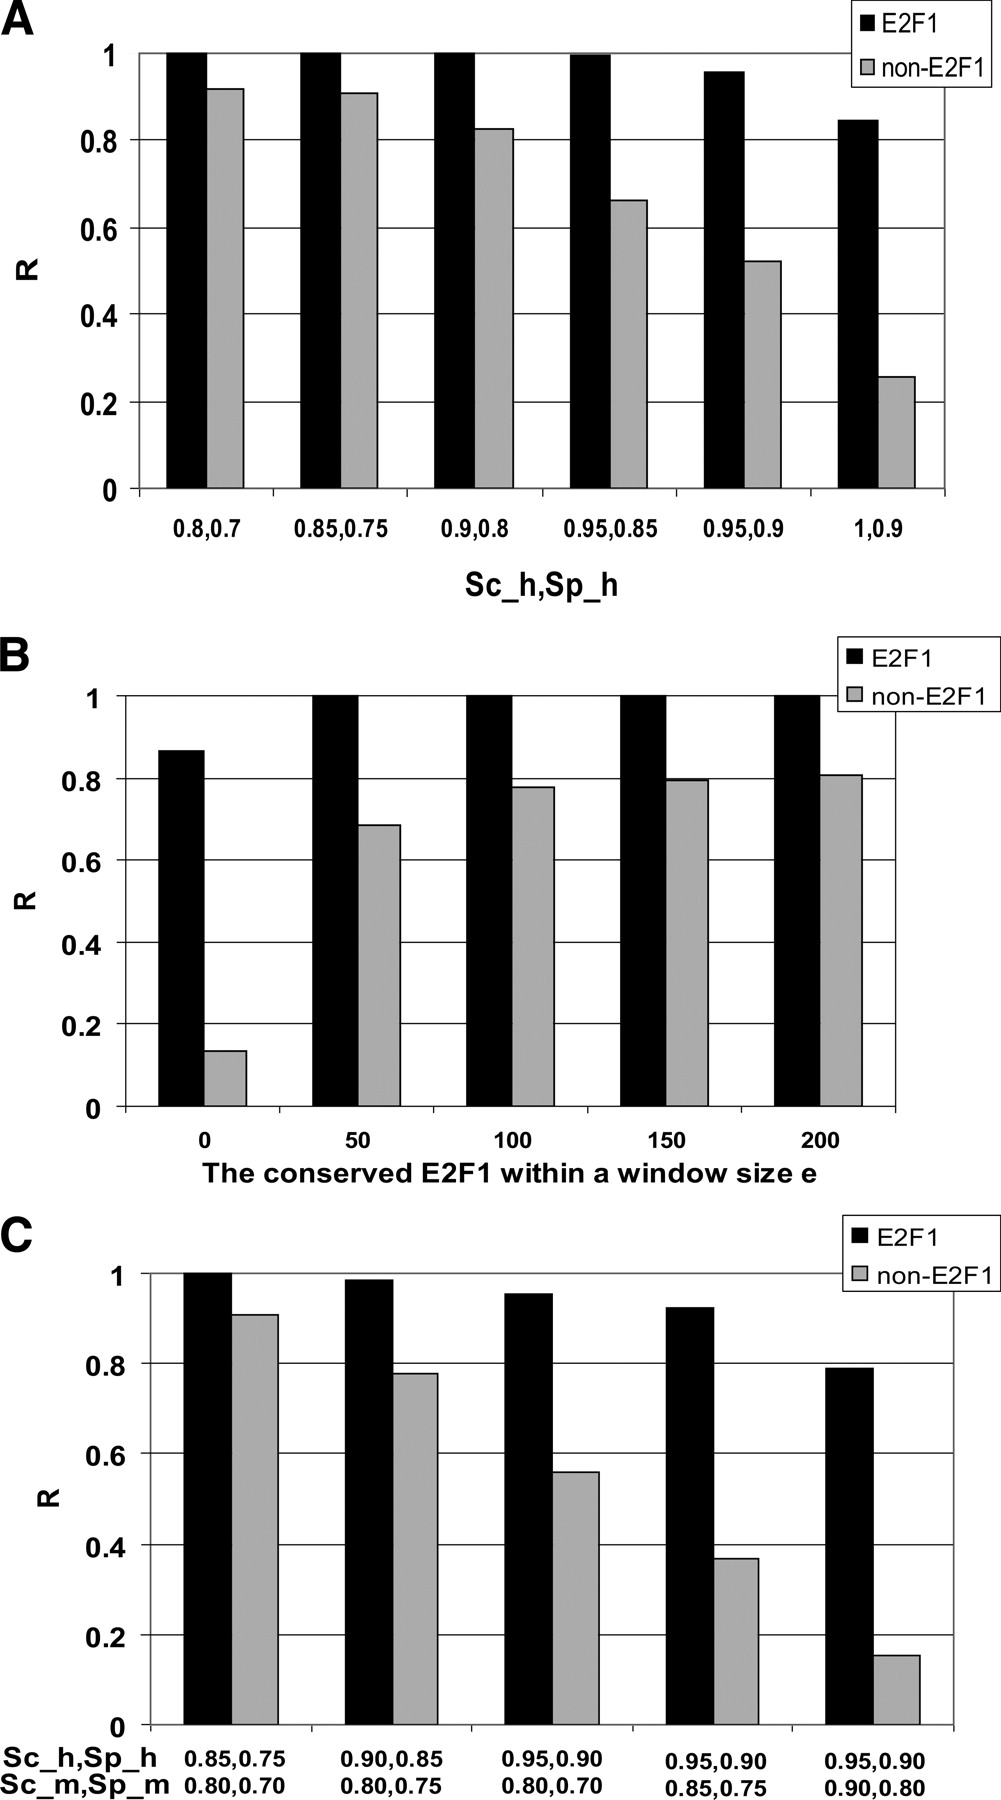
(A) A histogram graphical representation of the prediction rate (R) that a promoter contains an E2F1 binding site vs. several combinations of the match to the core Sc_h) or E2F1 PWM Sp_h) in the promoter. The values of 0.95 for Sc_h and 0.9 for Sp_h were chosen for the further analyses. (B) A histogram graphical representation of the prediction rate (R) that a human promoter contains an E2F1 binding site vs. a window size (e) for identifying an E2F1 site in the orthologous mouse promoter, using an Sc_m of 0.8 and an Sp_m of 0.7. (C) A histogram graphical representation of the prediction rate (R) that a human promoter contains an E2F1 binding site vs. several combinations of the match to the core sequences (Sc_h and Sc_m) and to the PWMs (Sp_h,, Sp_m) for both human and mouse promoters, using a window size of 100 bp. The values of 0.95 for Sc_h, 0.9 for Sp_H, 0.8 for Sc_m, and 0.7 for Sp_m were chosen for the further analyses.


