
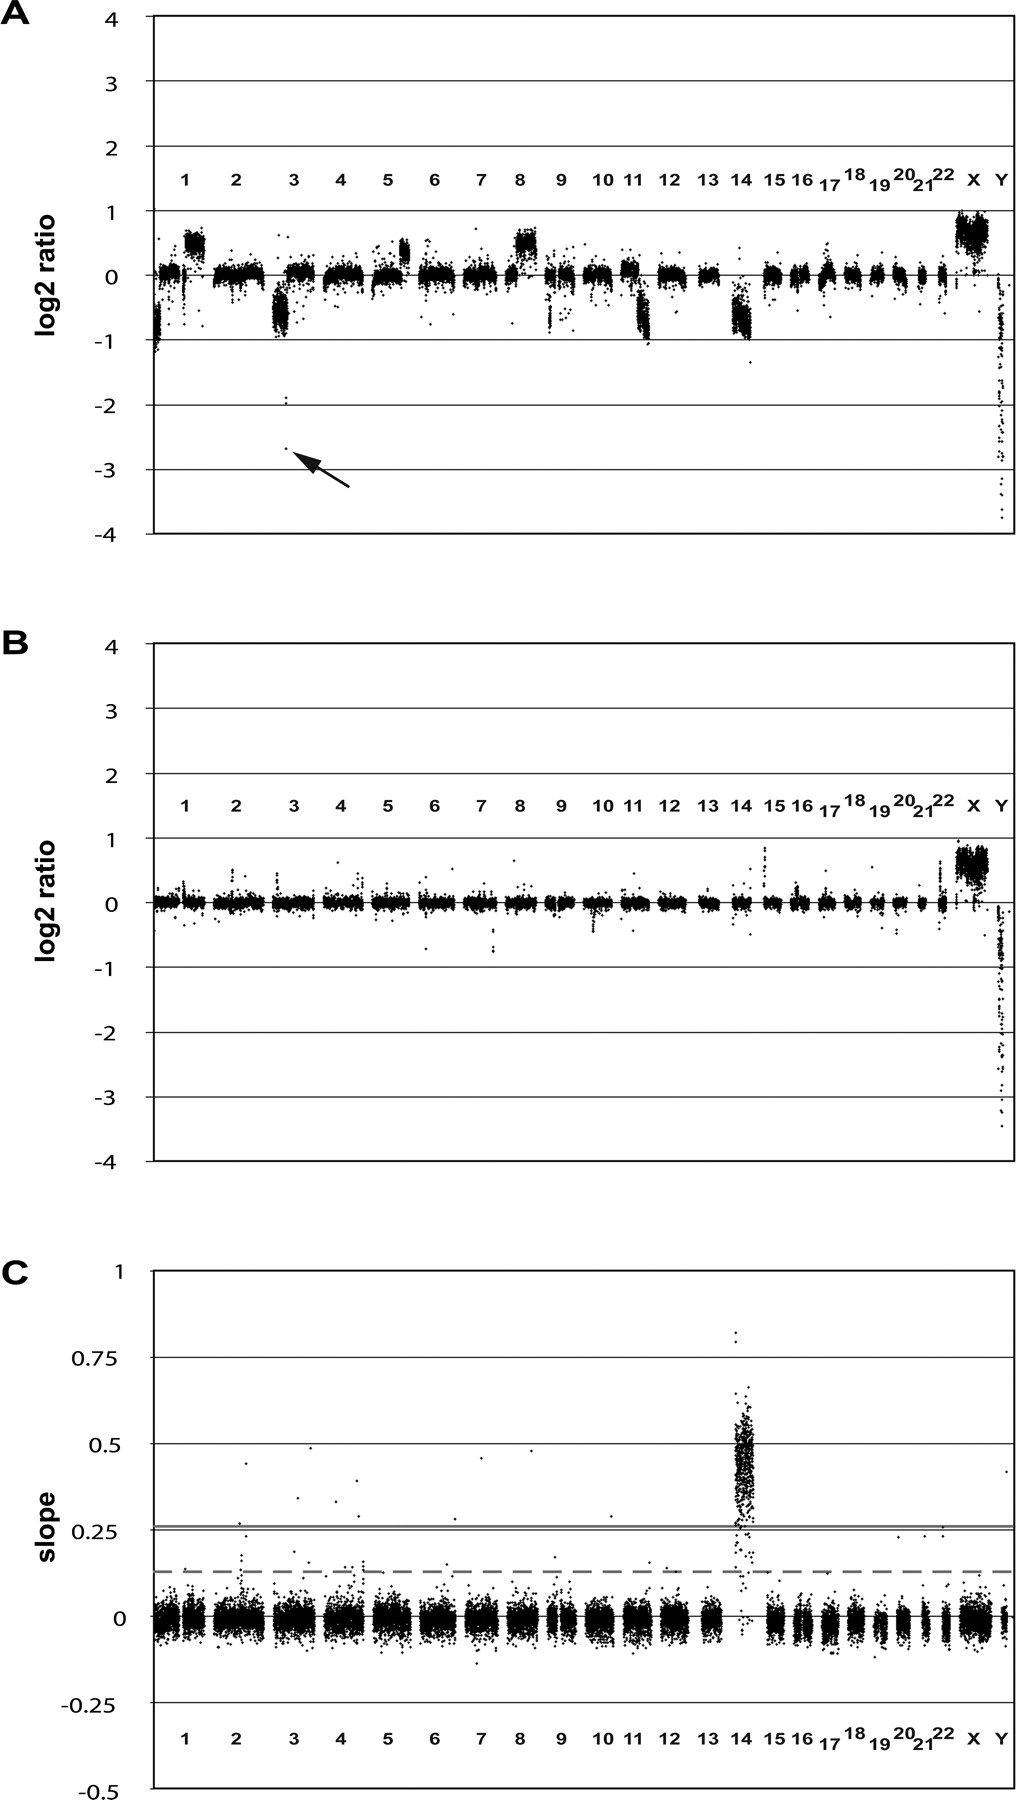
Figure 1.
Whole-genome tiling path array-CGH profiles. (A) Array-CGH profile for the renal cell carcinoma cell line 769P. The whole-genome tiling path array identified a previously undetected homozygous deletion on chromosome 3 (60.84–60.91 Mb, black arrow). (B) Array-CGH profile for NA15510 versus NA10851 (replicate A). (C) Chromosome 14 add-in profile. The slopes of response for each clone are plotted against the chromosomal position. (Gray continuous line) threshold of 10 times the standard deviation, (dashed gray line) threshold of five times the standard deviation (see Methods for details).


