
Table 4.
Comparison between our simulated data and real data
Click on table to view larger version.
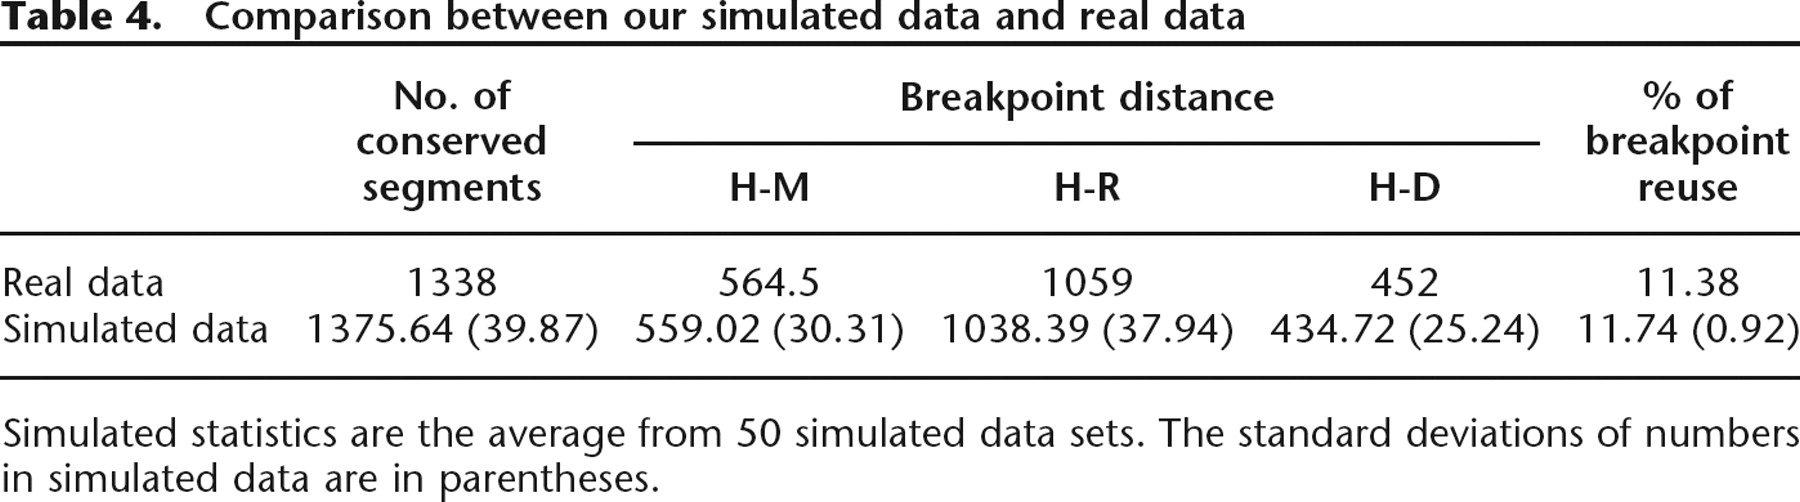
Simulated statistics are the average from 50 simulated data sets. The standard deviations of numbers in simulated data are in parentheses.


