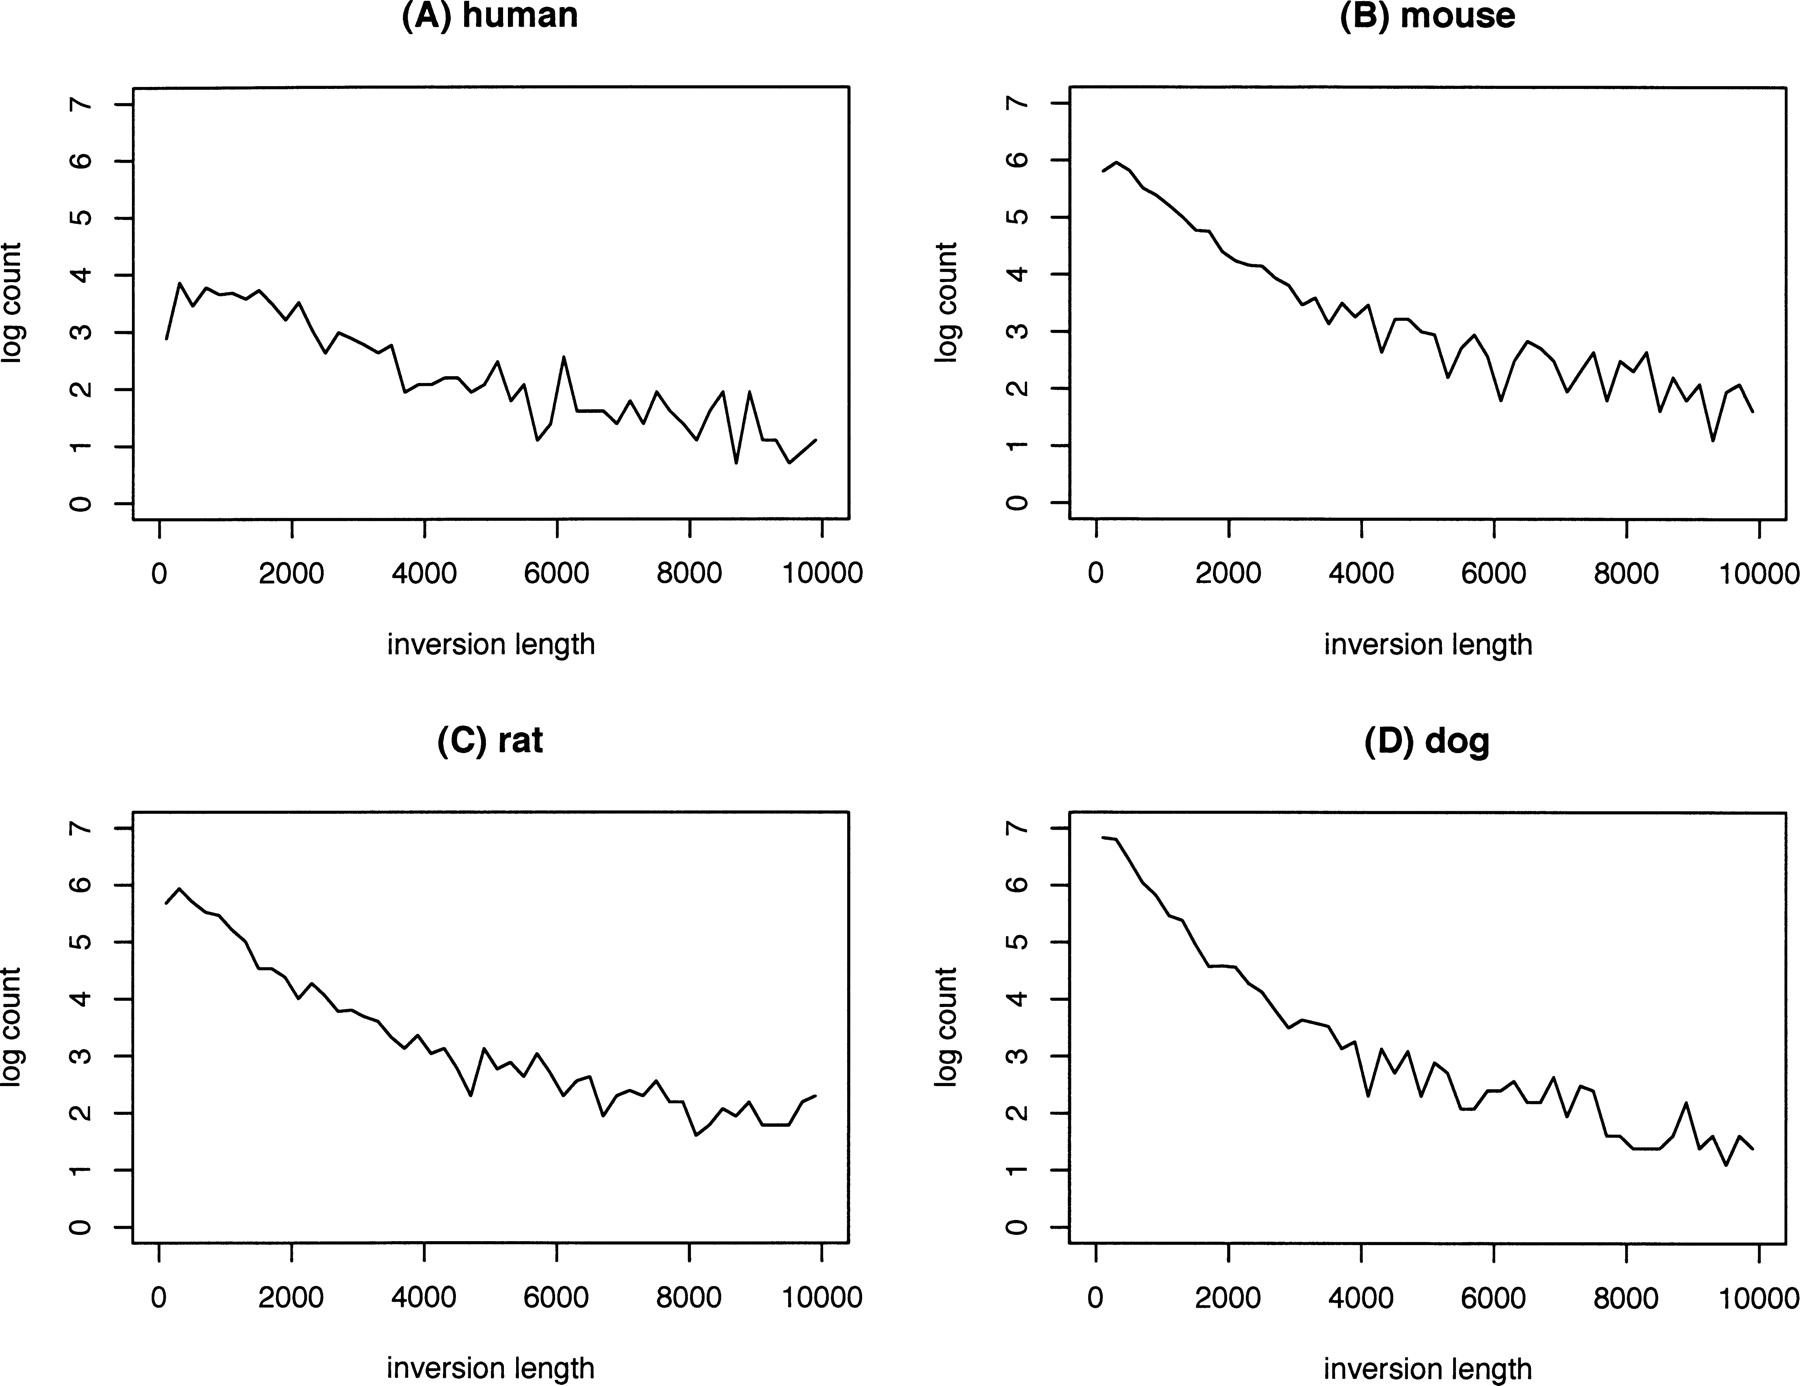
Reconstructing contiguous regions of an ancestral genome

(Downloading may take up to 30 seconds. If the slide opens in your browser, select File -> Save As to save it.)

Click on image to view larger version.

Figure 5.
Figure 5.

Length distribution of predicted inversions in human (A), mouse (B), rat (C), and dog (D). Inversions of lengths >10 kb are not represented in the plots. Inversions lengths are grouped into bins of 250 bp.

This Article

  1. Genome Res. 16: 1557-1565

Preprint Server