
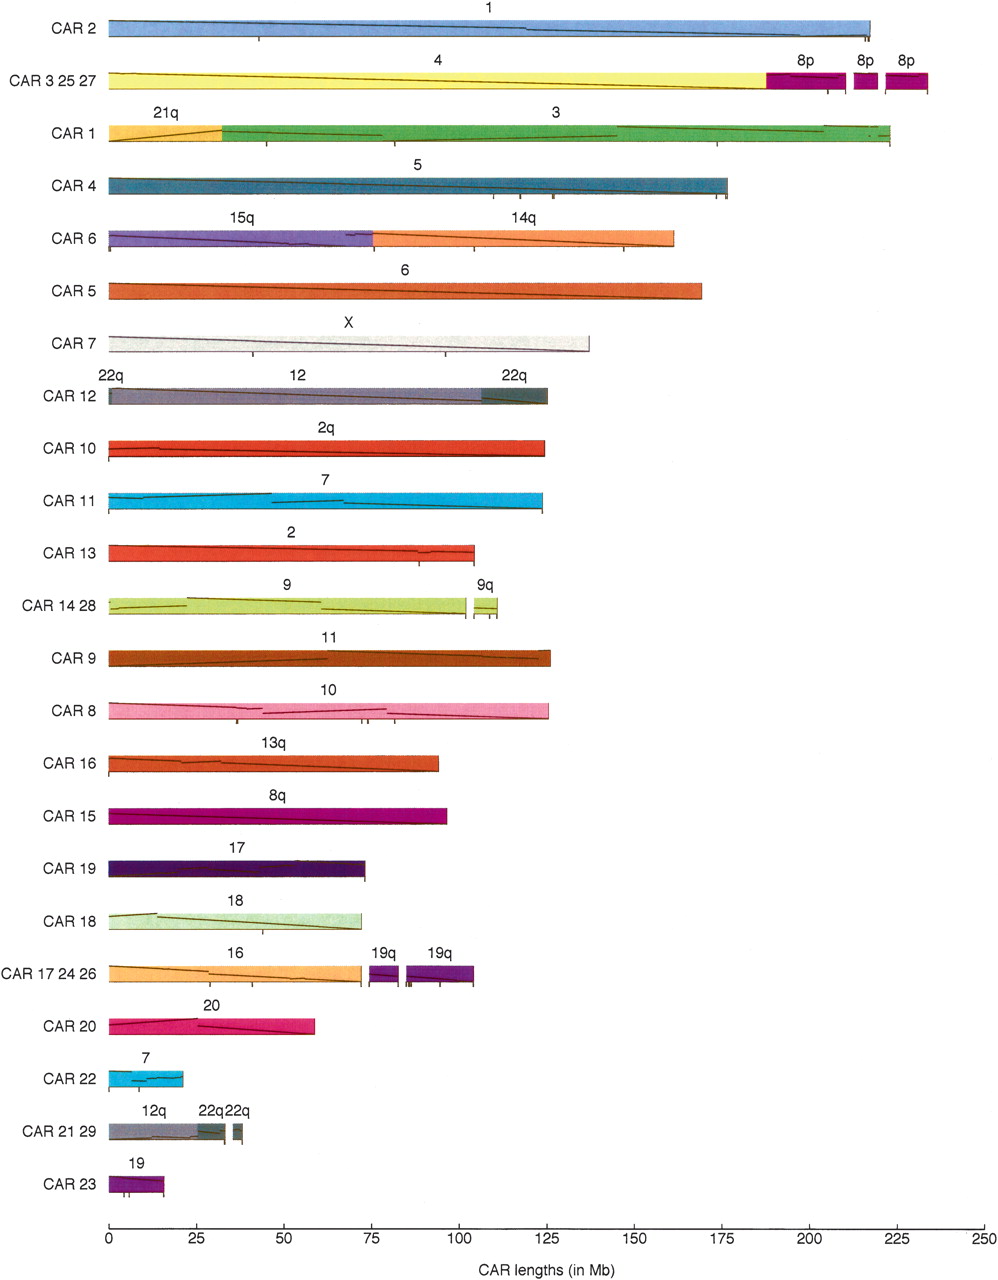
Figure 4.
Map of the Boreoeutherian ancestral genome. For lengths of each CAR and corresponding parts in mouse, rat, and dog, see Table 2. Numbers above bars indicate the corresponding human chromosomes. Black tick marks below the bars indicate ambiguous joins (Fig. 7 in Methods; for details, see Supplemental material). Our predicted CARs are colored and ordered to facilitate comparison with Froenicke et al. (2006). Gaps between CARs are joins suggested by Froenicke et al. (2006). Diagonal lines within each block show the orientation and position in the human chromosome (Bourque et al. 2006).


