
Table 2.
Average strength of purifying selection in essential and nonessential genes, and in E-families and N-families
Click on table to view larger version.
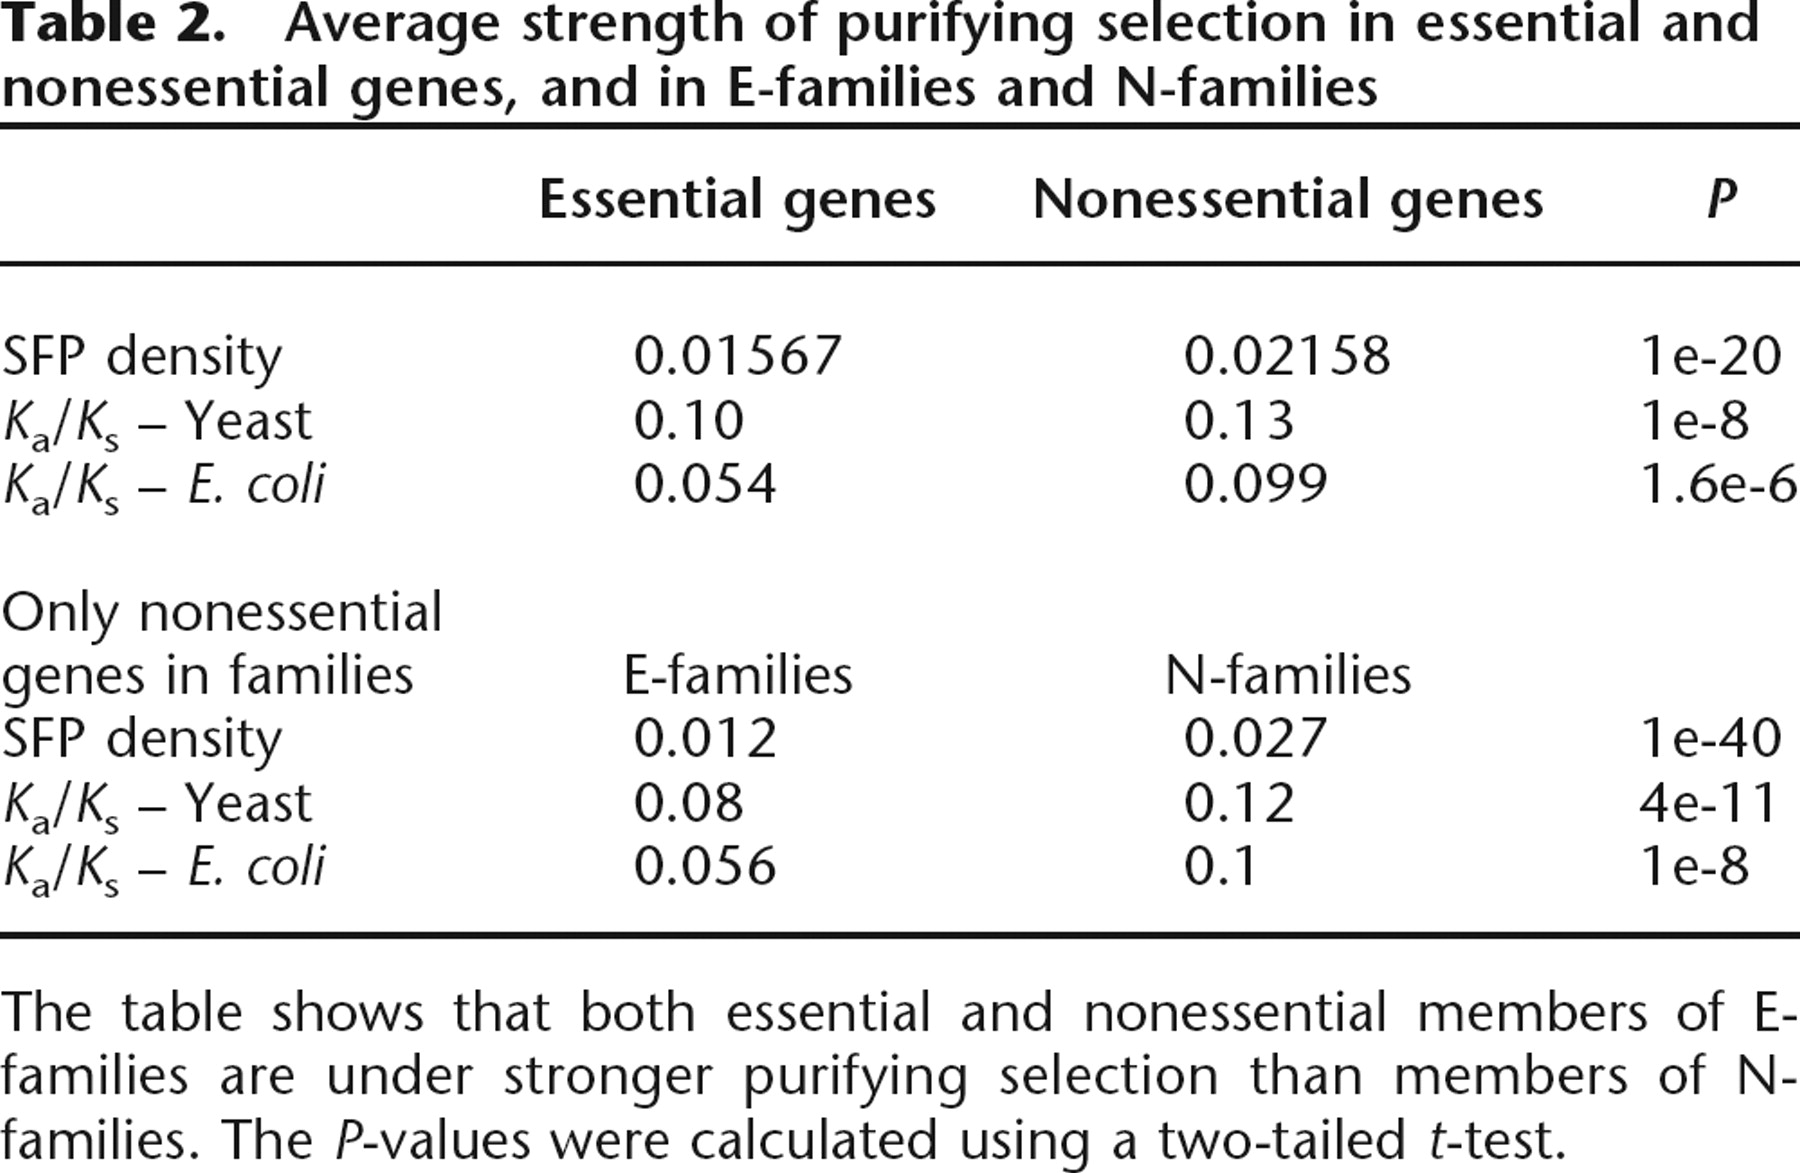
The table shows that both essential and nonessential members of E-families are under stronger purifying selection than members of N-families. The P-values were calculated using a two-tailed t-test.


