
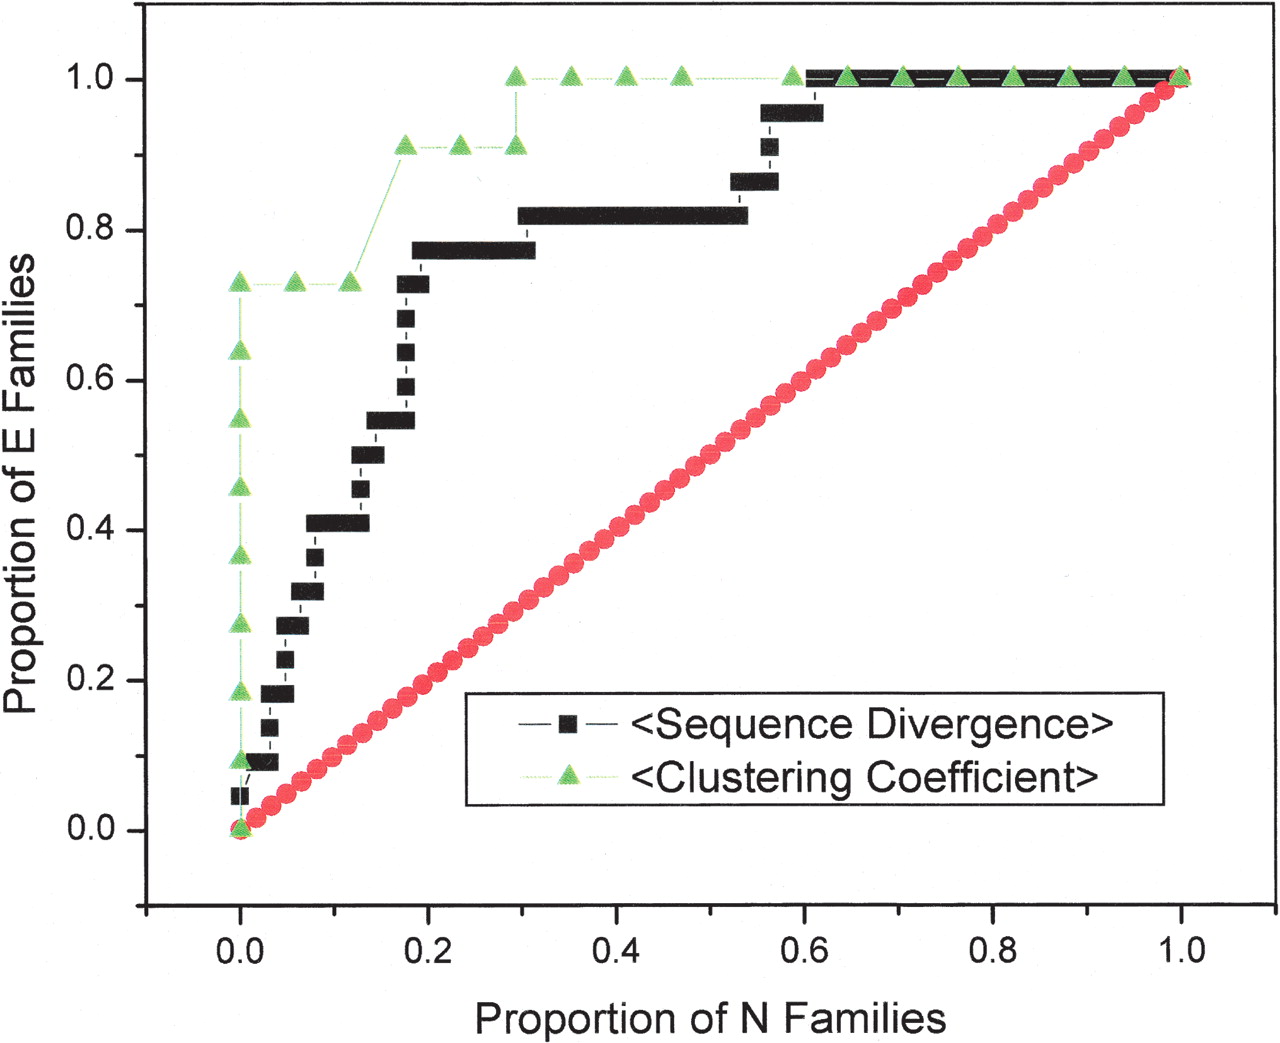
ROC curves predicting whether a family belongs to the E- or N-class based on average sequence divergence of paralogs and clustering coefficient. Paralogous gene families (strongly connected components of DDG) were sorted by average sequence divergence between all pairs of paralogs (black squares) and clustering coefficients (green triangles). Only families with more than two members were analyzed, and families with a clustering coefficient of 0 were excluded as uninformative. This results in 23 E-families and 63 N-families for the sequence divergence calculation and 12 E-families and 18 N-families for the clustering coefficient calculation. The red diagonal line represents random expectation.


