
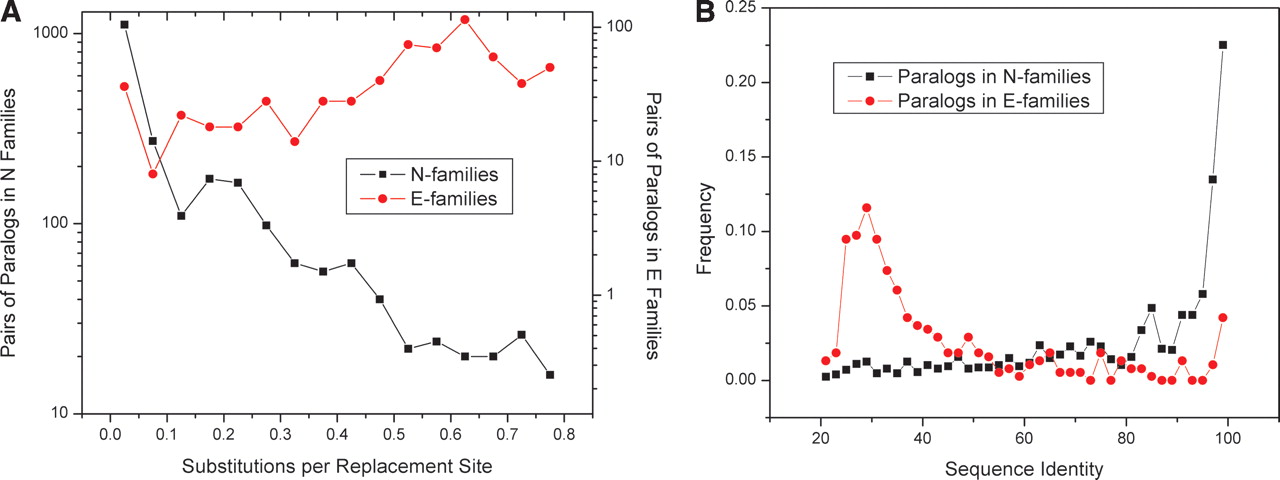
Figure 3.
Sequence divergence in E-families and N-families. (A) Distributions of the nonsynonymous substitution rates (Ka) for pairs of paralogs in N-families (black squares) and E-families (red circles). The mean Ka values are ∼0.5 for E-families and ∼0.14 for N-families (P < 1e-50). (B) Distributions of sequence identity for pairs of paralogs in E-families (red circles) and N-families (black squares). The mean sequence identity was ∼40% for pairs of paralogs in E-families and ∼73% for pairs of paralogs in N-families (P < 1e-40).


