
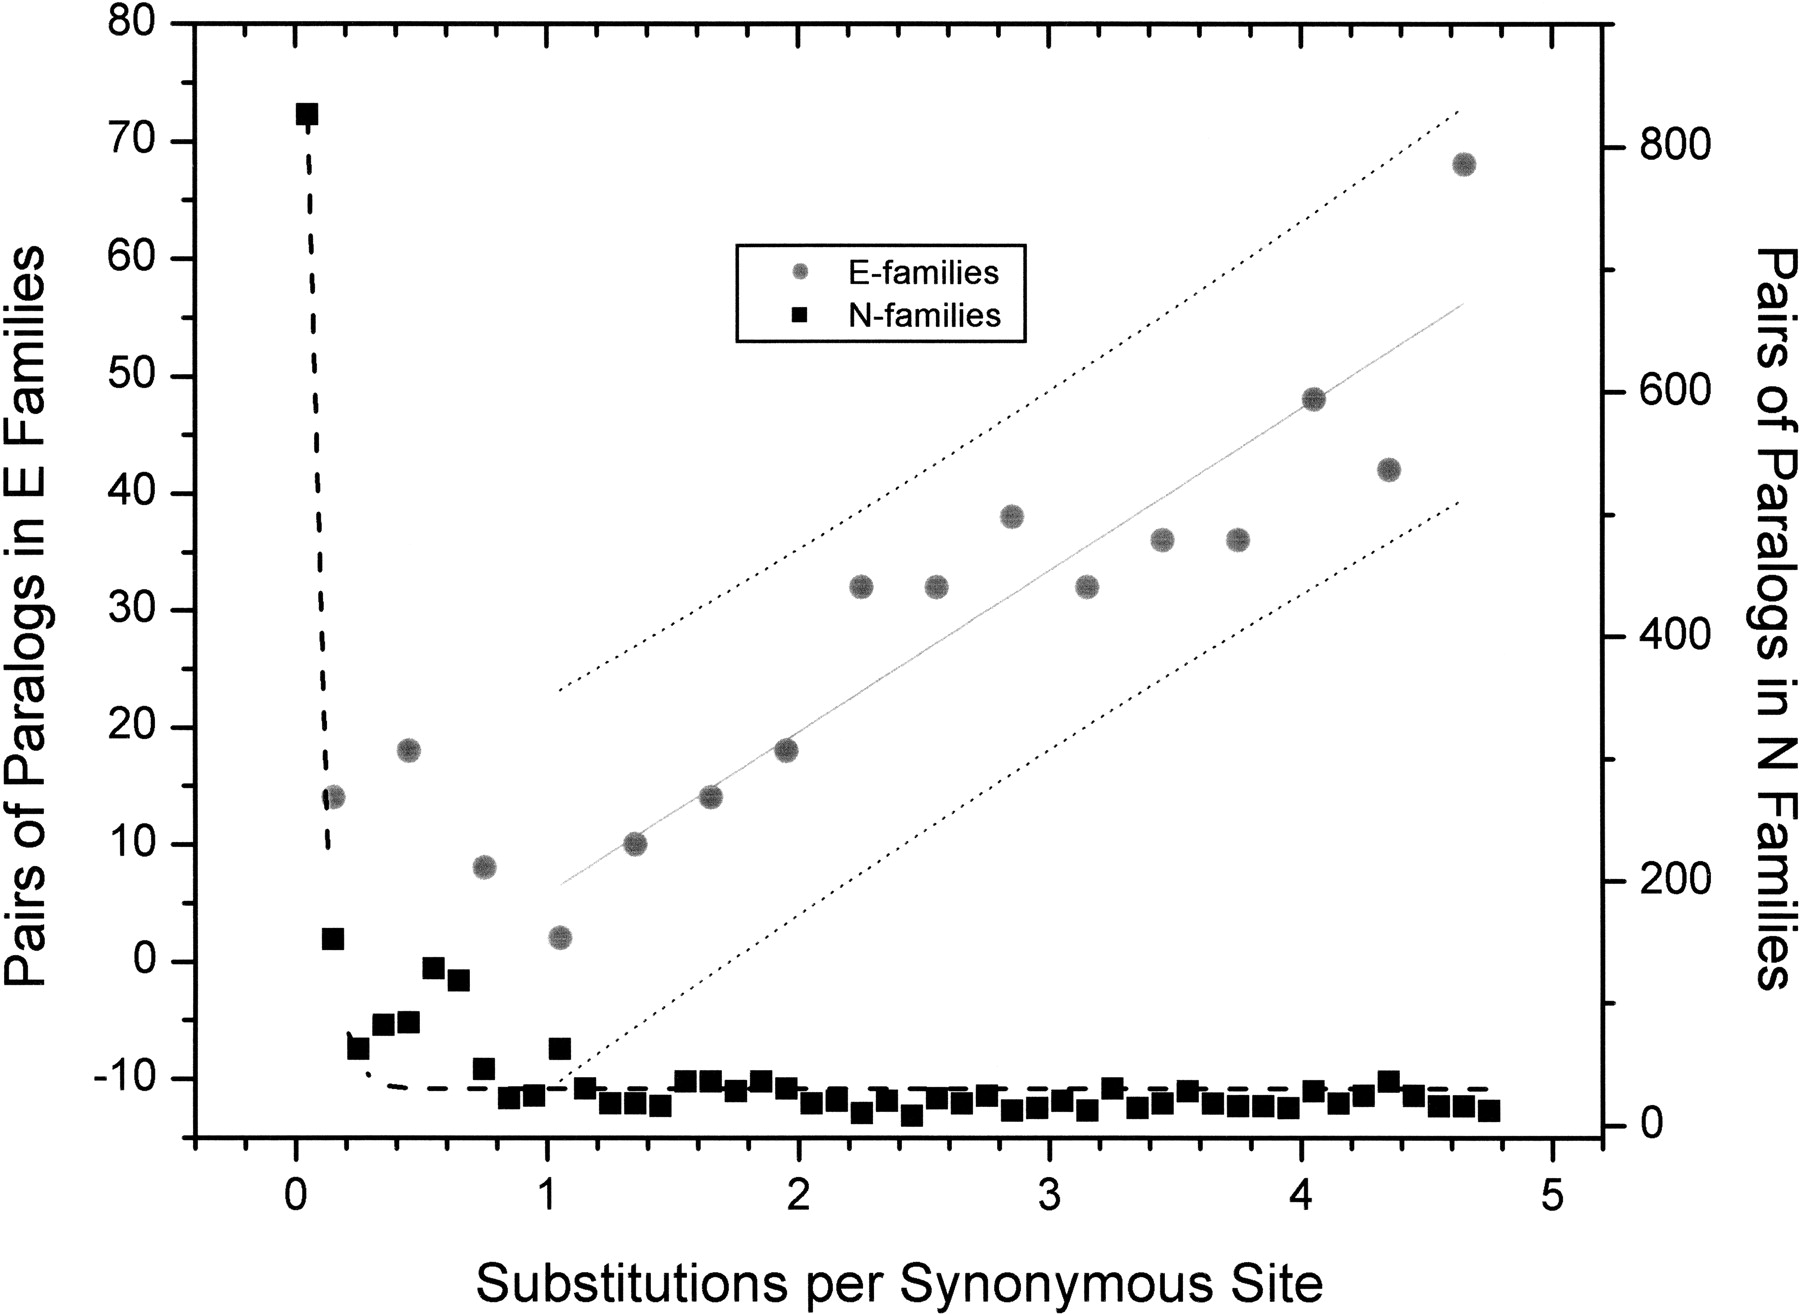
Figure 2.
Distributions of synonymous substitution rates (Ks) for pairs of paralogs in E-familes (gray circles) and N-families (black squares). The x-axis is the Ks values and the y-axis is the number of pairs. The Ks bins are 0.3 for E-families and 0.1 for N-families. The black dashed line is the fit of the exponential decay for the paralogs from N-families (R2 = 0.96, P < 0.001). The solid gray line is the linear fit for the Ks divergence of paralogs in E-families (R2 = 0.86, P < 0.001).


