
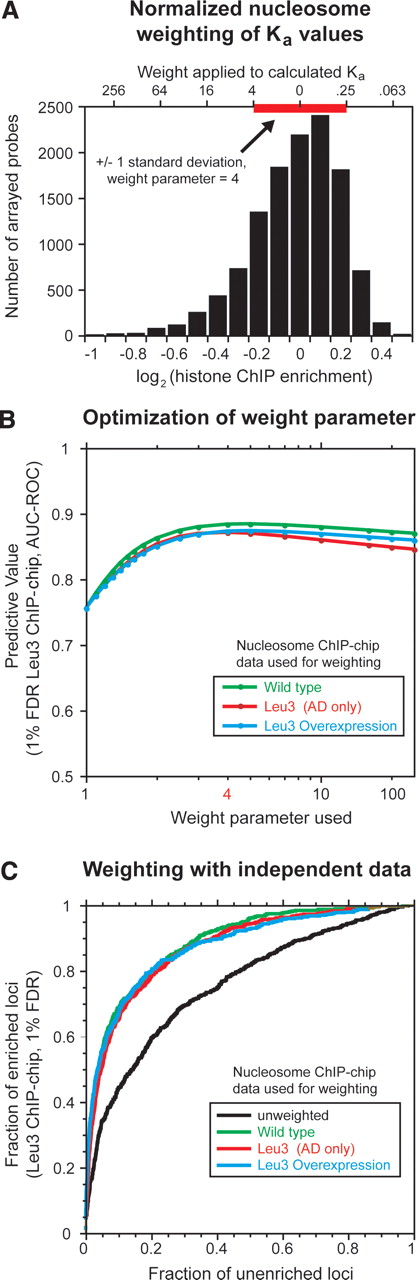
Quantitation of chromatin contributions to DNA binding-site utilization. (A) Histogram of histone ChIP-enrichment values and their use in weighting predicted Leu3 binding affinities. The plotted histone enrichment values are based on seven independent histone H3 and histone H4 ChIP-chip experiments (Methods) (Lee et al. 2004). The standard deviation of the combined distribution (red bar, ±1 standard deviation = 0.223 units) was used to determine the weight (upper x-axis) applied to a given log2 enrichment value (lower x-axis). Weights calculated at −4, −3, −2, −1, 0, 1, and 2 standard deviations from the median using a weight parameter of 4 are shown on the upper x-axis as an example. In the actual calculation used to weight motifs for the prediction of Leu3 binding, unbinned nucleosome occupancy values were used. Telomeric probes, mitochondrial probes, and probes for which no Leu3 ChIP data were available were excluded from the analysis. A small number of probes (∼0.2%) have histone ChIP-enrichment values that extend beyond the boundaries of this plot. The left and right edges of the red bar correspond to Z-scores of −1 and 1, respectively. (B) AUC-ROC at different weight parameters using nucleosome occupancy data obtained from the indicated strains. (C) ROC curves showing the effect of nucleosome occupancy weighting on the prediction of Leu3 binding in vivo. GOMER occupancy scores were calculated for all array probes using the Leu3 EMSA-derived PWM, weighted with nucleosome occupancy data from the strain indicated (green, wild type; red, overexpressed Leu3 activation domain [AD] only, with no Leu3 DNA binding activity; brown, overexpressed full-length Leu3). ROC curves plot the fraction of Leu3 ChIP-enriched probes (FDR = 1%) that exceed a given occupancy score versus the fraction of unenriched probes that meet the same threshold, effectively calculated at all possible threshold values. Nucleosome occupancies were normalized as described in A, and used to weight predicted Leu3 Ka values at a weight parameter of 4.


