
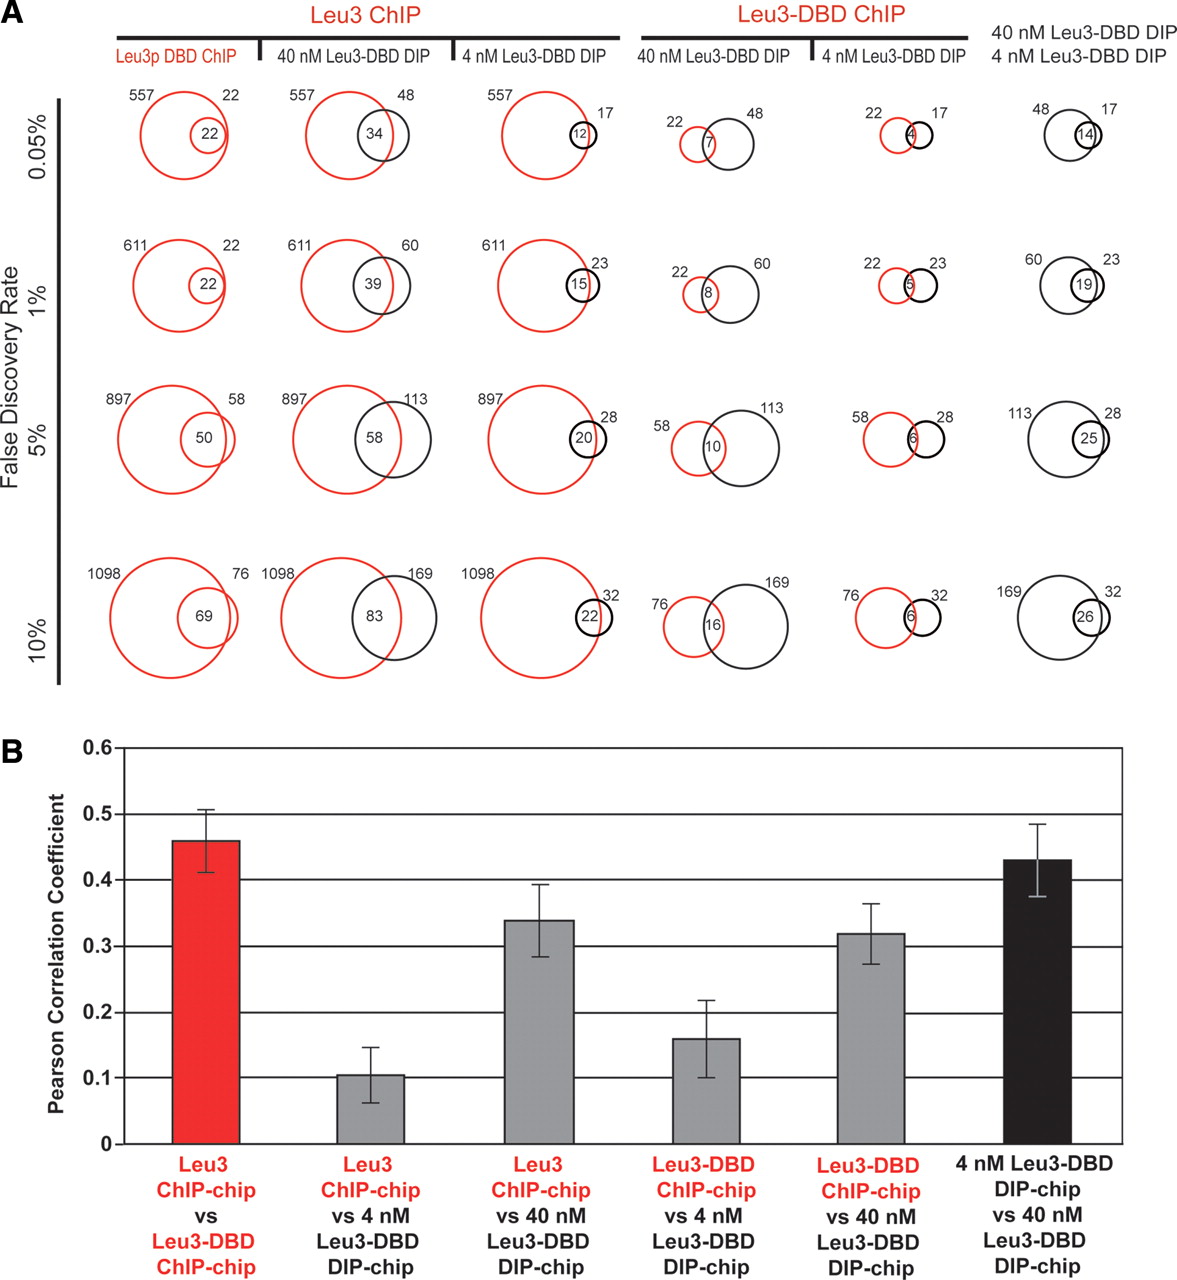
Leu3 binds different genomic locations in vivo and in vitro. (A) Each vertical column contains comparisons of two Leu3 genomic binding experiments. Each horizontal row shows pairwise comparisons at the indicated FDR (0.05%, 1%, 5%, or 10%). FDRs were calculated based on P-values derived from a modified single-array error model (SAEM: Methods). Red circles represent the number of targets bound in the indicated in vivo ChIP-chip experiments, and black circles represent the number of targets bound in the indicated in vitro DIP-chip experiments. In all columns, the circle to the left corresponds to the upper-most label on the top row, while the circle to the right corresponds to the lower label. Numbers to the left and right of the circles indicate the total number of Leu3-bound loci. The number of Leu3-bound loci common to both experiments is indicated in the intersection of the circles. (B) In vivo experiments (red) and in vitro experiments (black) are more highly correlated with each other than are data across experiment types (gray). For each pairwise comparison, the Pearson’s correlation of all log (SAEM; P-values) is shown.


