
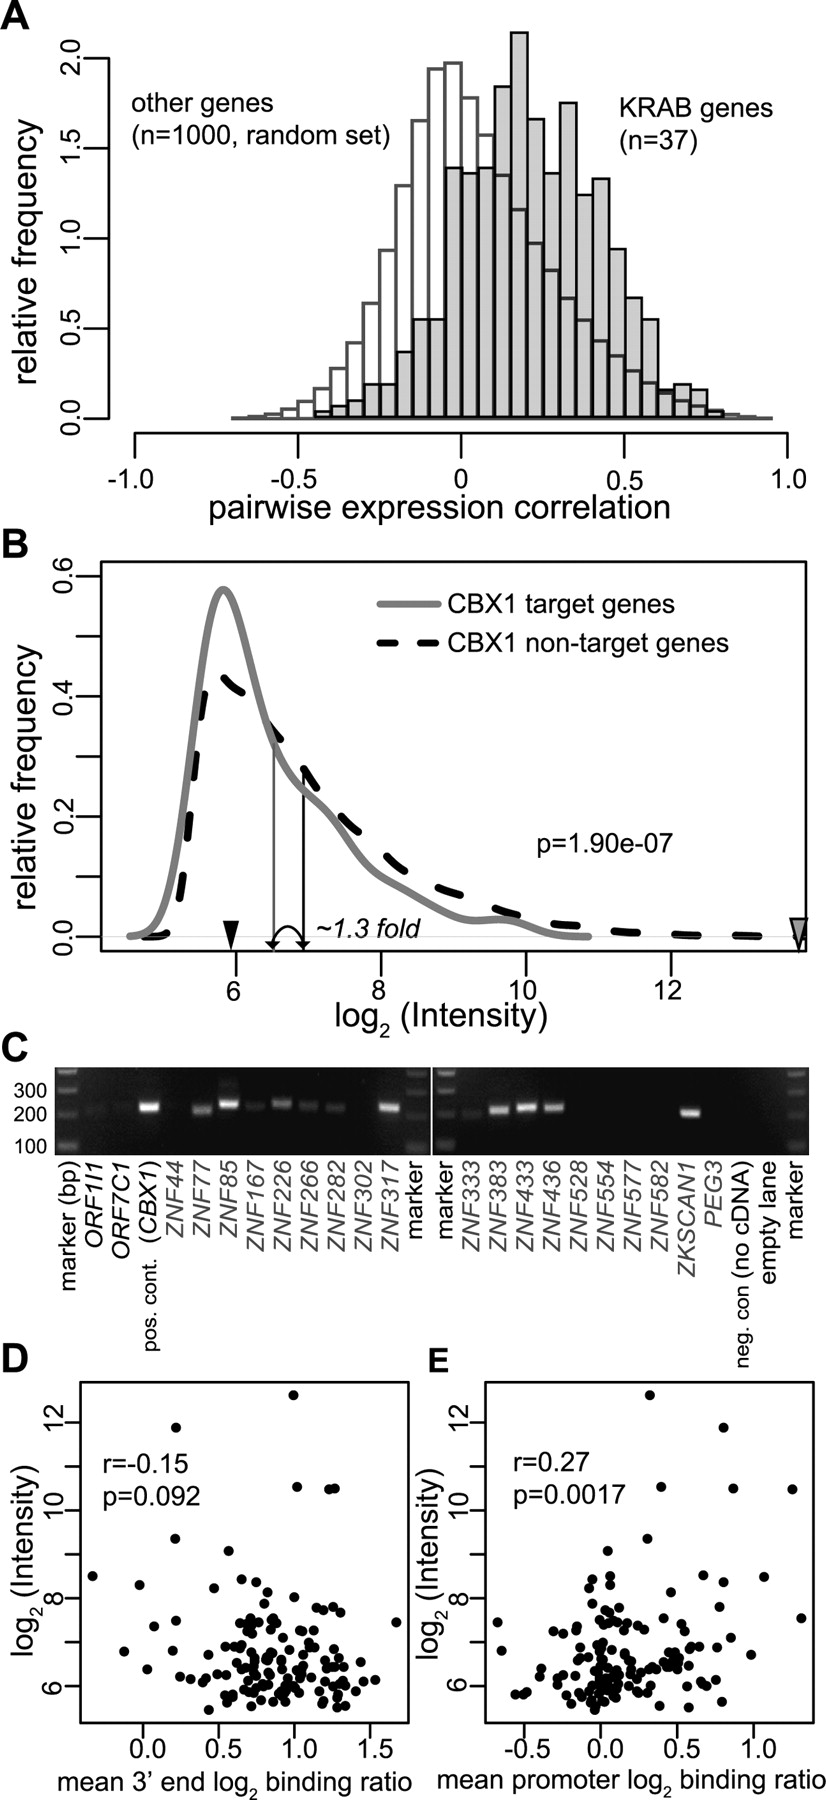
Expression of KRAB-ZNF genes and CBX1 target genes. (A) KRAB-ZNF genes are coexpressed in 79 human tissues. Microarray expression data for 37 KRAB-ZNF genes or 1000 randomly picked non-KRAB-ZNF genes were obtained from Su et al. (2004). For each gene pair, the pairwise Pearson correlation in expression throughout 79 different tissues was calculated. Histograms present pairwise correlation coefficients between KRAB-ZNF genes (gray) or non-KRAB-ZNF genes (white). (B) CBX1 target genes have slightly lower expression levels than CBX1 nontarget genes in MCF7 cells. MCF7 expression profiles were made on coding region oligonucleotide arrays and the density distribution of spot intensities (log2 √(Cy5 × Cy3)) of CBX1 target genes (gray line) and CBX1 nontarget genes (dashed black line) is shown. The average spot intensity per group is indicated by vertical arrows. P-value is according to the Wilcoxon rank sum test. The expression levels of an inactive gene (Testis-Specific Serine Kinase Substrate) and a highly active gene (beta-actin) are indicated by black and gray arrowheads, respectively. (C) The majority of KRAB-ZNF genes is expressed in MCF7 cells. RT-PCR of 19 KRAB-ZNF genes. ZNF436, ZNF167, ZKSCAN1, and ZNF282 are located on chromosomes 1, 3, 7, and 7, respectively. The other KRAB-ZNF genes are located on Chr19. Controls include the ORF1I1 and ORF7C1 olfactory receptor genes that are expected to be repressed in MCF7 cells, CBX1 that is expressed in MCF7 cells, and a negative control with CBX1 primers without cDNA. (D,E) Correlation between expression level and CBX1 binding to 3′ end (D) or promoters (E) of KRAB-ZNF genes. Average CBX1 binding to the last 3′ 2 kb or to the 2 kb surrounding the transcriptional start site of 139 KRAB-ZNF genes was linked to the expression data from B. P-values are according to Spearman’s ρ statistic.


