
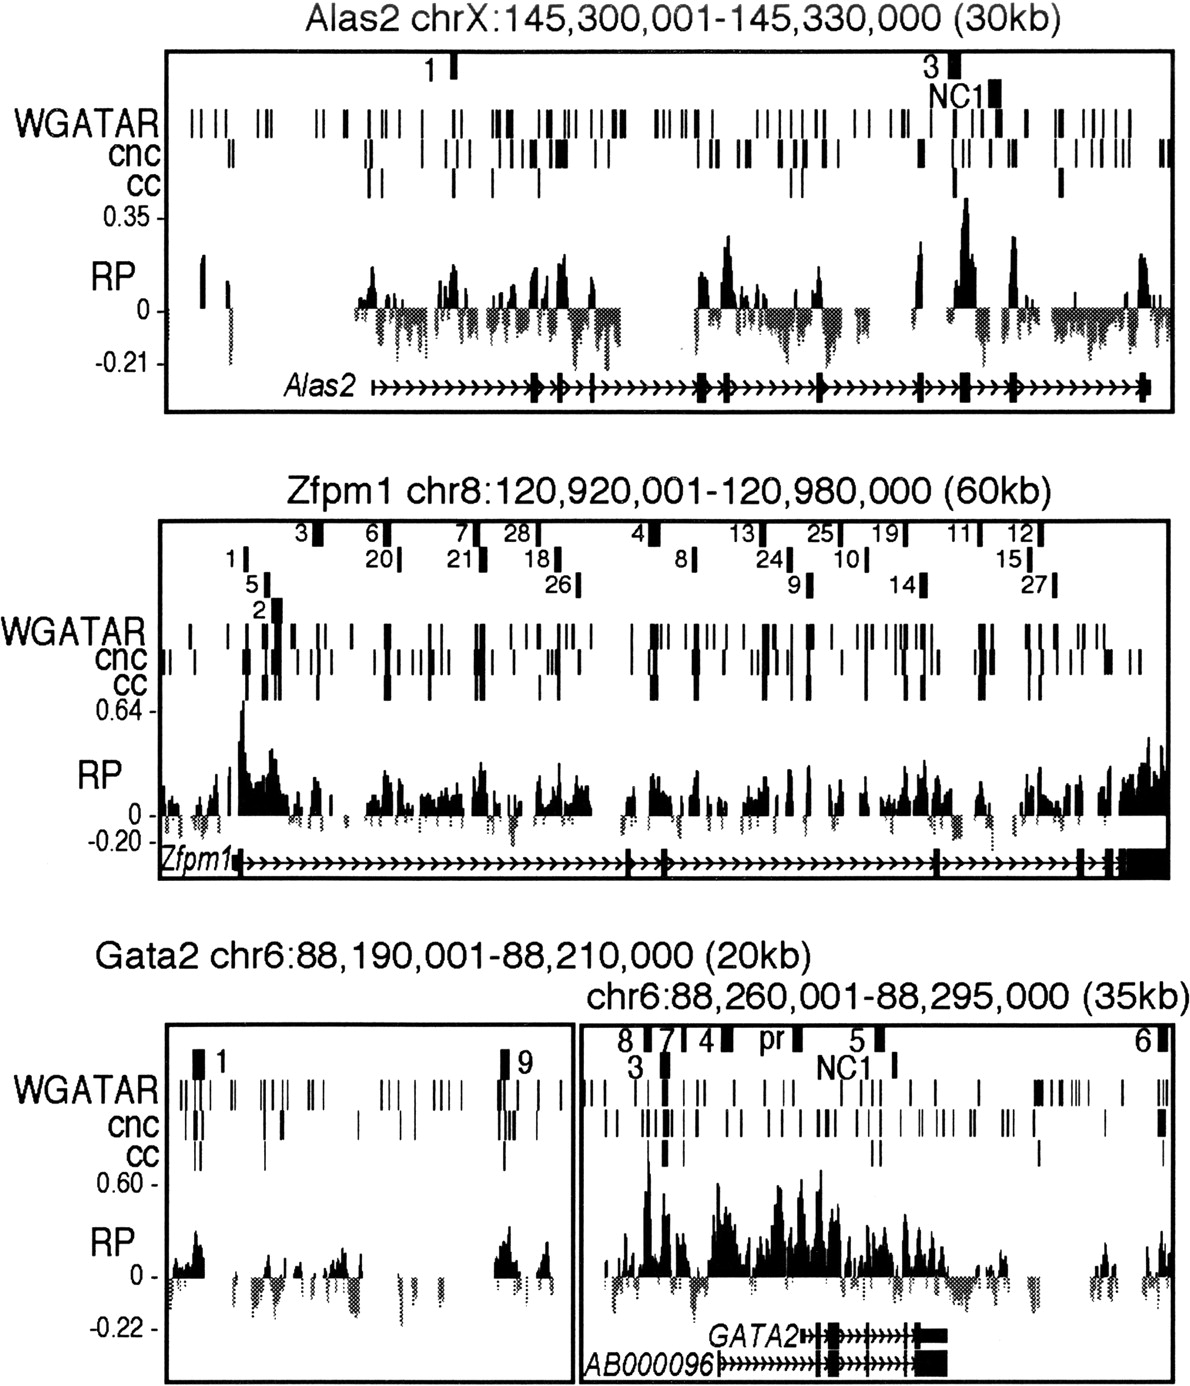
Figure 1.
Maps of three target loci with preCRMs and genomic features. The tracks in each graph show chromosomal coordinates (mm7 assembly), positions and abbreviated names of preCRMs, positions of both ccGATA1BSs (matches to conserved consensus GATA-1 binding sites) and cncGATA1BSs (matches to position specific weight matrix of GATA-1 binding sites), a graph of the RP score based on five-species TBA alignments, and the gene exon–intron structure. Similar maps for Btg2, Hebp1, Hipk2, Hist1h1c, and Vav2 are in Supplemental Figure S2.


