
Multivariate analysis of clinical parameters shown in Table 3
Click on table to view larger version.
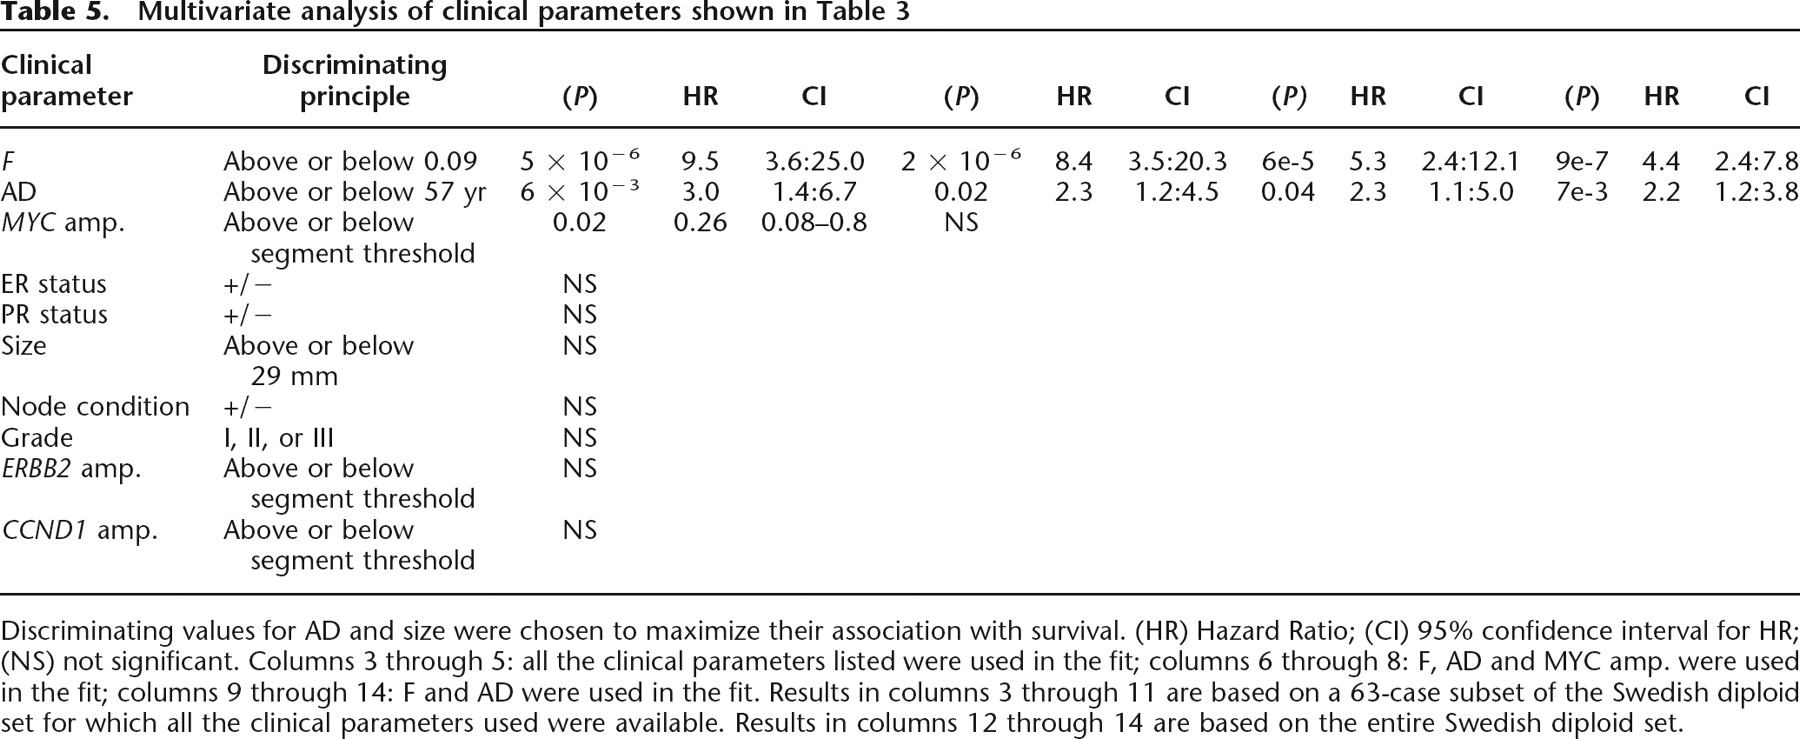
Discriminating values for AD and size were chosen to maximize their association with survival. (HR) Hazard Ratio; (CI) 95% confidence interval for HR; (NS) not significant. Columns 3 through 5: all the clinical parameters listed were used in the fit; columns 6 through 8: F, AD and MYC amp. were used in the fit; columns 9 through 14: F and AD were used in the fit. Results in columns 3 through 11 are based on a 63-case subset of the Swedish diploid set for which all the clinical parameters used were available. Results in columns 12 through 14 are based on the entire Swedish diploid set.


