
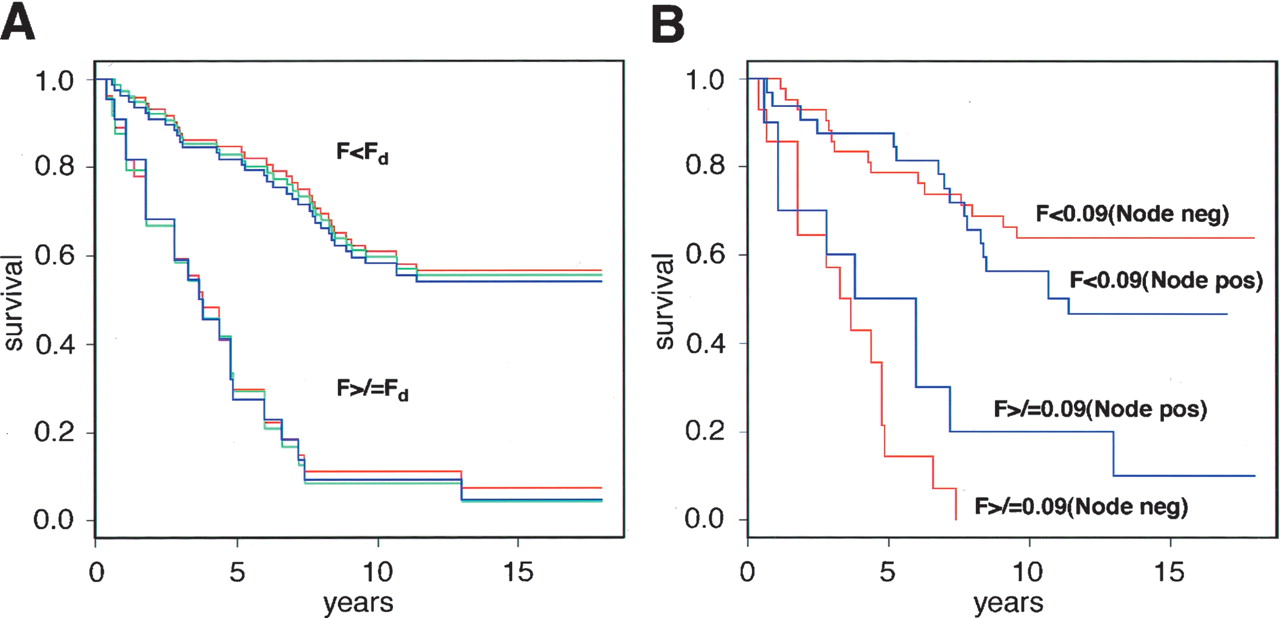
Figure 6.
Kaplan-Meier plots of the Swedish diploid subset grouped according to the Firestorm Index (F). (A) Complete Swedish diploid data set grouped according to three different discriminator settings (Fd) of F: Fd = 0.08 (red); Fd = 0.09 (blue); Fd = 0.1 (green). (B) Swedish diploid data set separated into node-negative (red) and node-positive (blue) subsets with Fd set to 0.09.


