
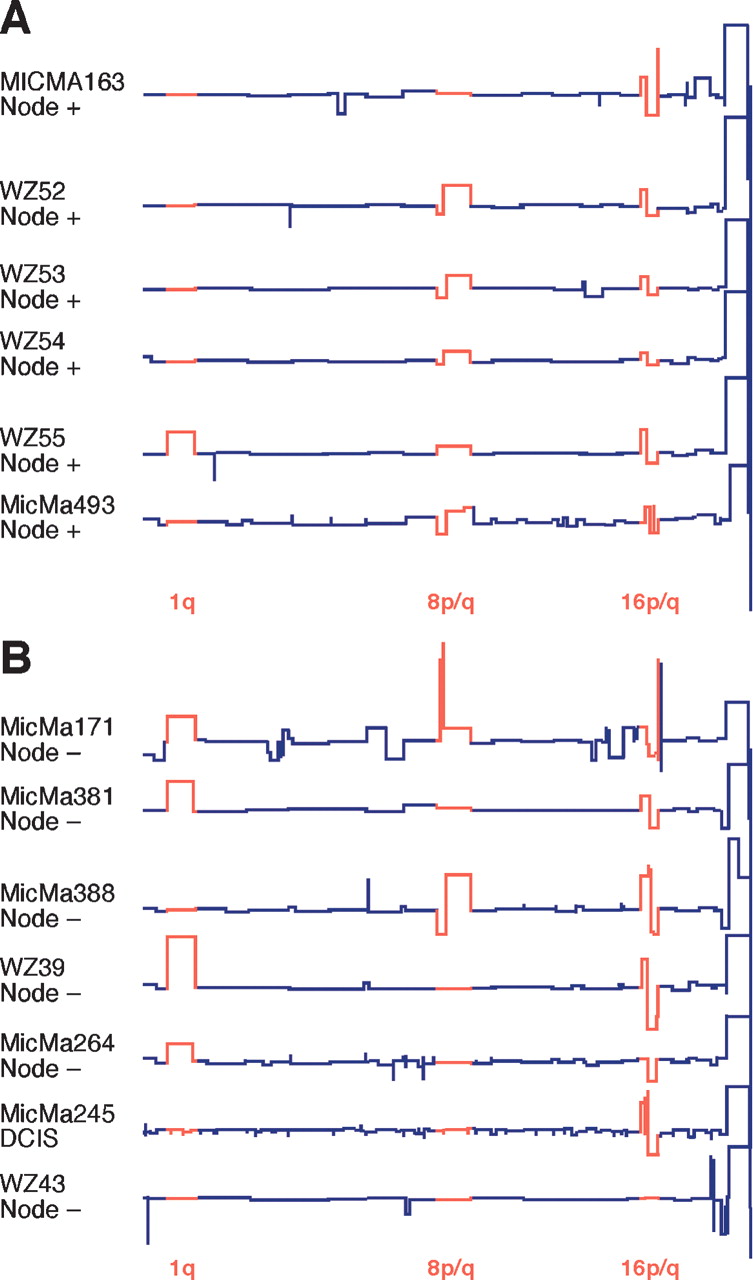
Figure 5.
Comparison of Grade I and DCIS tumors by ROMA. Segmented ROMA profiles of six node-positive (Fig. 5A) and seven node-negative (Fig. 5B) Grade I or DCIS tumors, representing a total of 24 examples from the combined Swedish and Norwegian collections. Most frequent rearrangements are depicted in red.


