
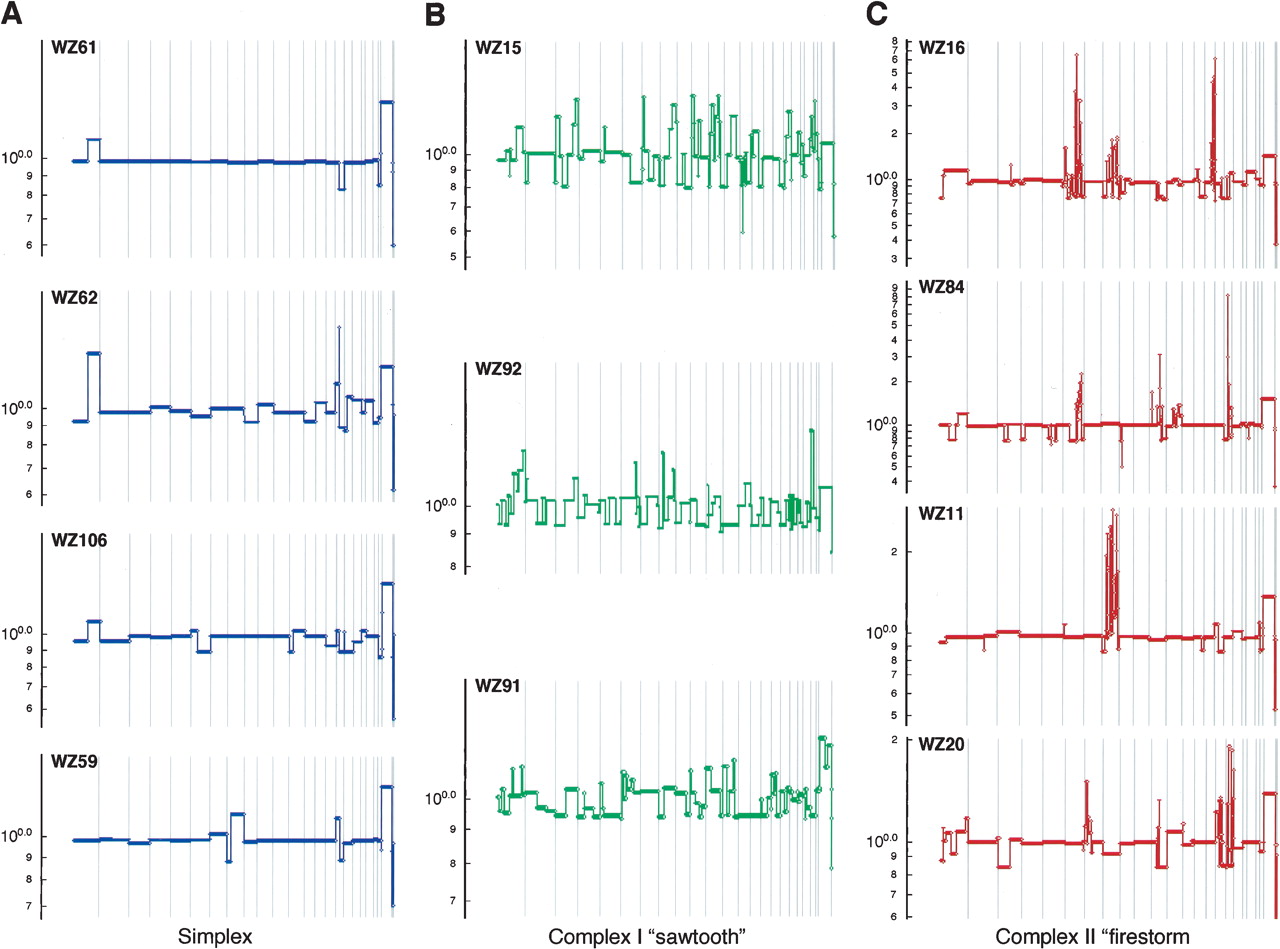
Figure 2.
Major types of tumor genomic profiles. Segmentation profiles for individual tumors representing each category: (A) simplex; (B) complex type I or sawtooth; (C) complex type II or firestorm. Scored events consist of a minimum of six consecutive probes in the same state. The y-axis displays the geometric mean value of two experiments on a log scale. Note that the scale of the amplifications in C is compressed relative to A and B owing to the high levels of amplification in firestorms. Chromosomes 1–22 plus X and Y are displayed in order from left to right according to probe position.


