
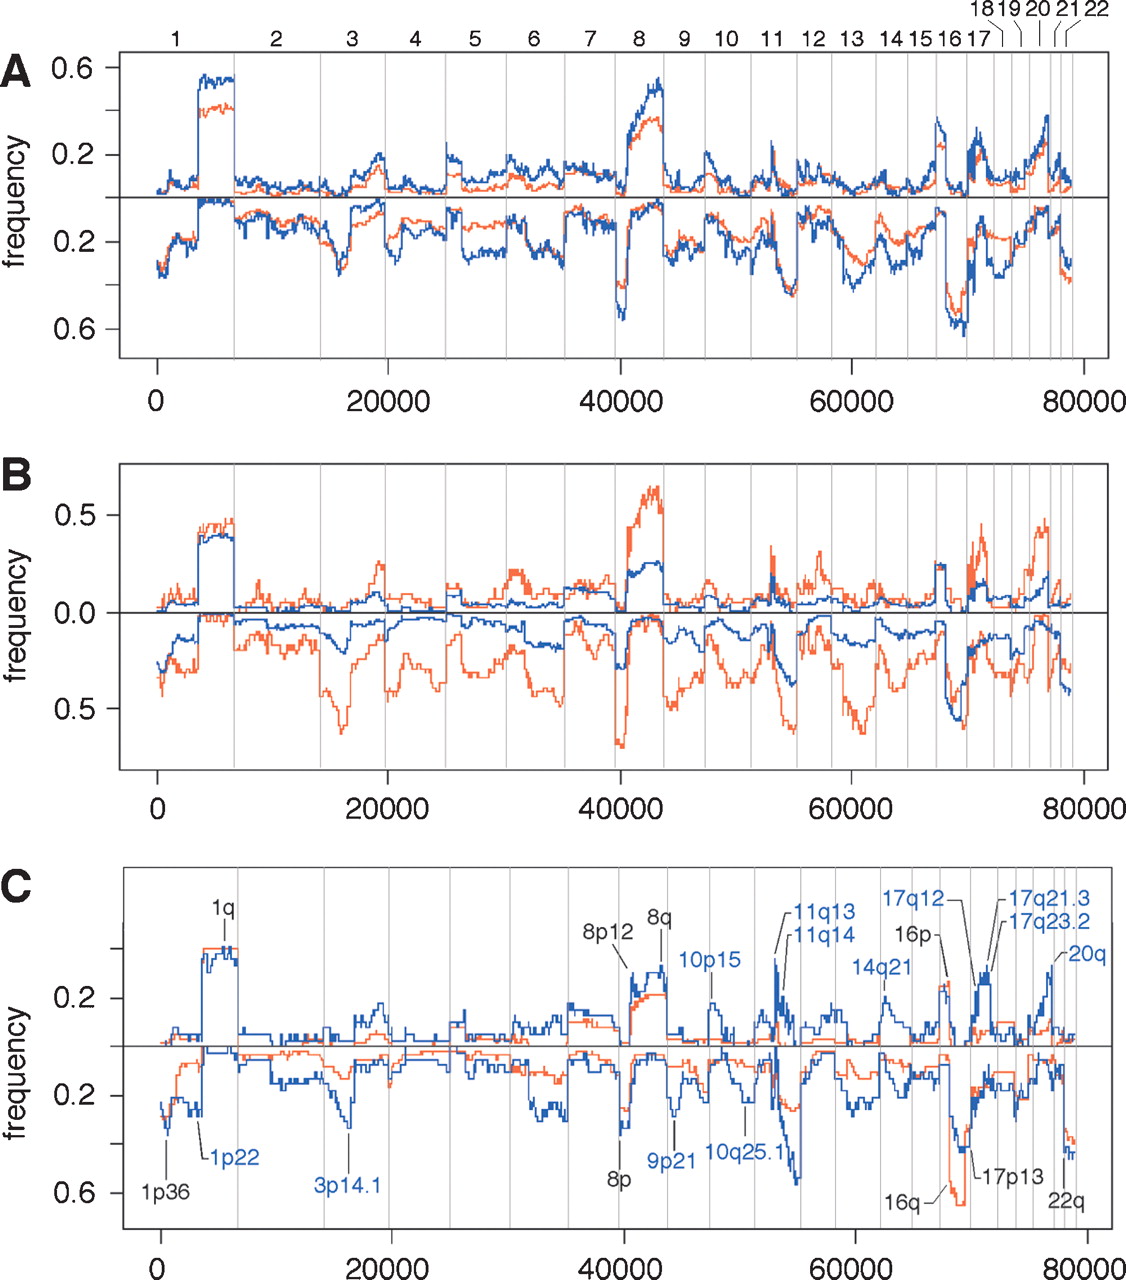
Figure 1.
Comparative frequency plots of amplification (up) and deletion (down) in various data sets. Frequency calculated on normalized, segmented ROMA profiles using a minimum of six consecutive probes identifying a segment with a minimum mean of 0.1 above (amplification) or below (deletion) baseline. Frequencies are plotted only for chromosomes 1–22. (A) Total Swedish data set (red) versus total Norwegian data set (blue). (B) Swedish diploid subset (blue) versus total Swedish aneuploid subset (red). (C) Swedish diploid 7-yr survivors (red) versus Swedish diploid 7-yr nonsurvivors (blue).


