
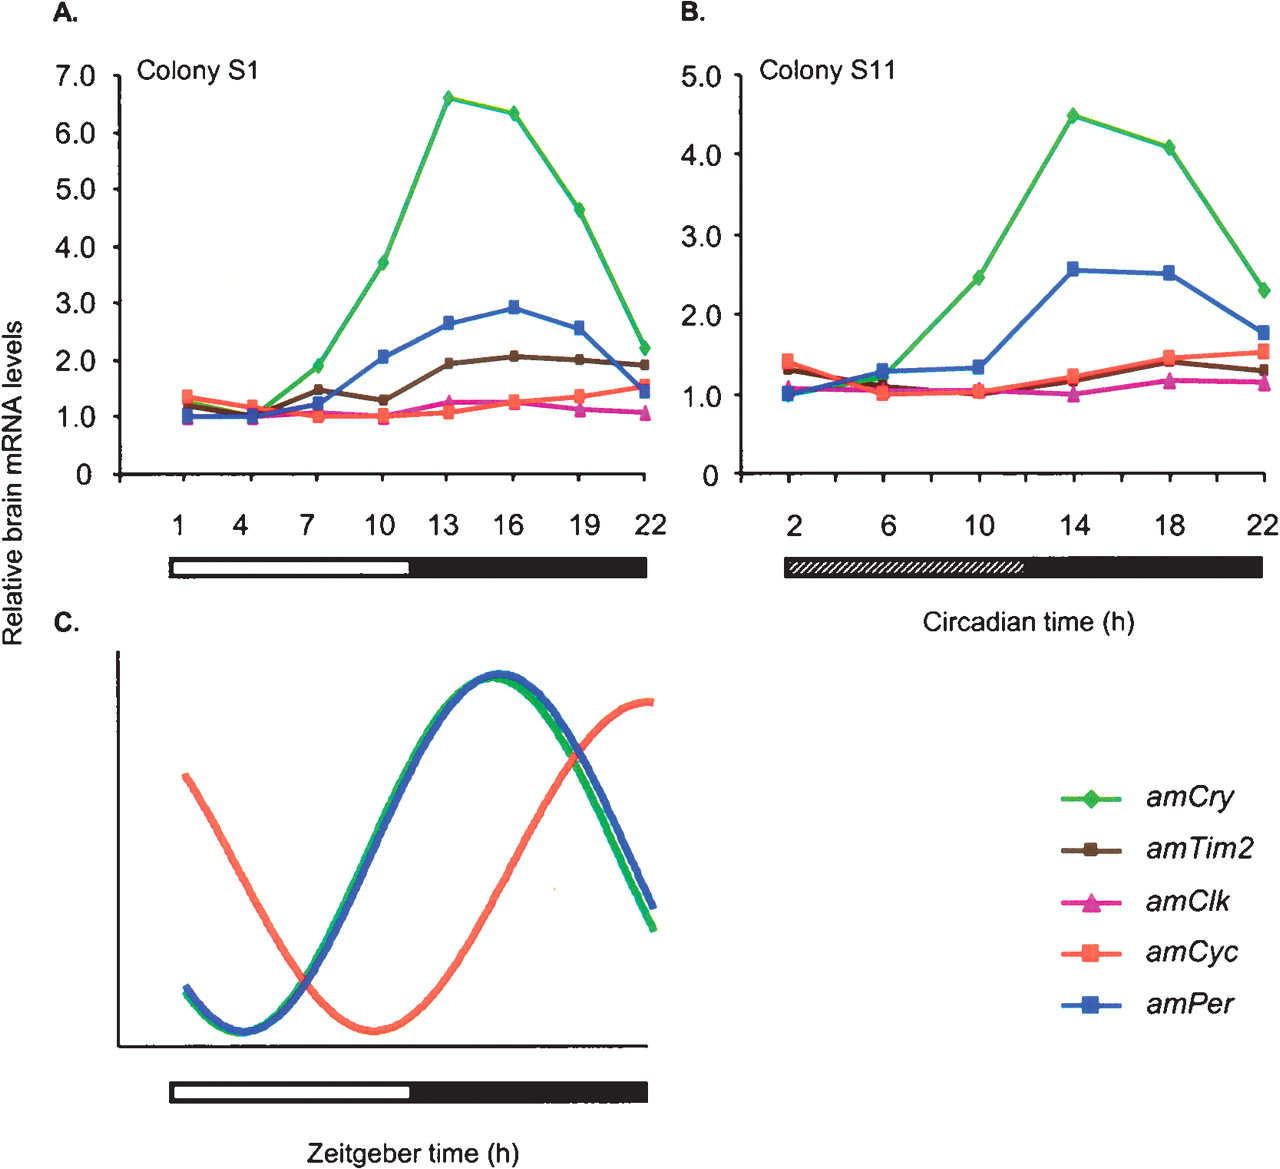
The relationships between brain transcript abundance over time for five putative honey bee clock genes in foragers from free-flying colonies. Brain mRNA levels for all genes were measured from the same RNA sample. (A) Foragers entrained and collected in light: dark illumination regime (LD). Colony S1, n = 6 bees/time point (same data as in Fig. 6). (B) Foragers entrained in LD and collected in constant darkness. Colony S11, n = 6 bees/time point (same data as in Fig. 7). (C) Schematic representation of the oscillations of clock genes in the honey bee brain in LD and DD illumination regimes. The phase of mRNA cycling is shown for amPer,amCry, and amCyc for which there is a strong correlation with a cosinus model with about a 24-h cycle. The phase of amCyc transcript is almost in antiphase to that of amPer and amCry. For clarity, the model does not include amClk that does not oscillate and amTim for which the pattern of mRNA variation over time was not consistent across experiments. Amplitudes for the various genes are not to scale. For additional details, see Figures 6 and 7.


