
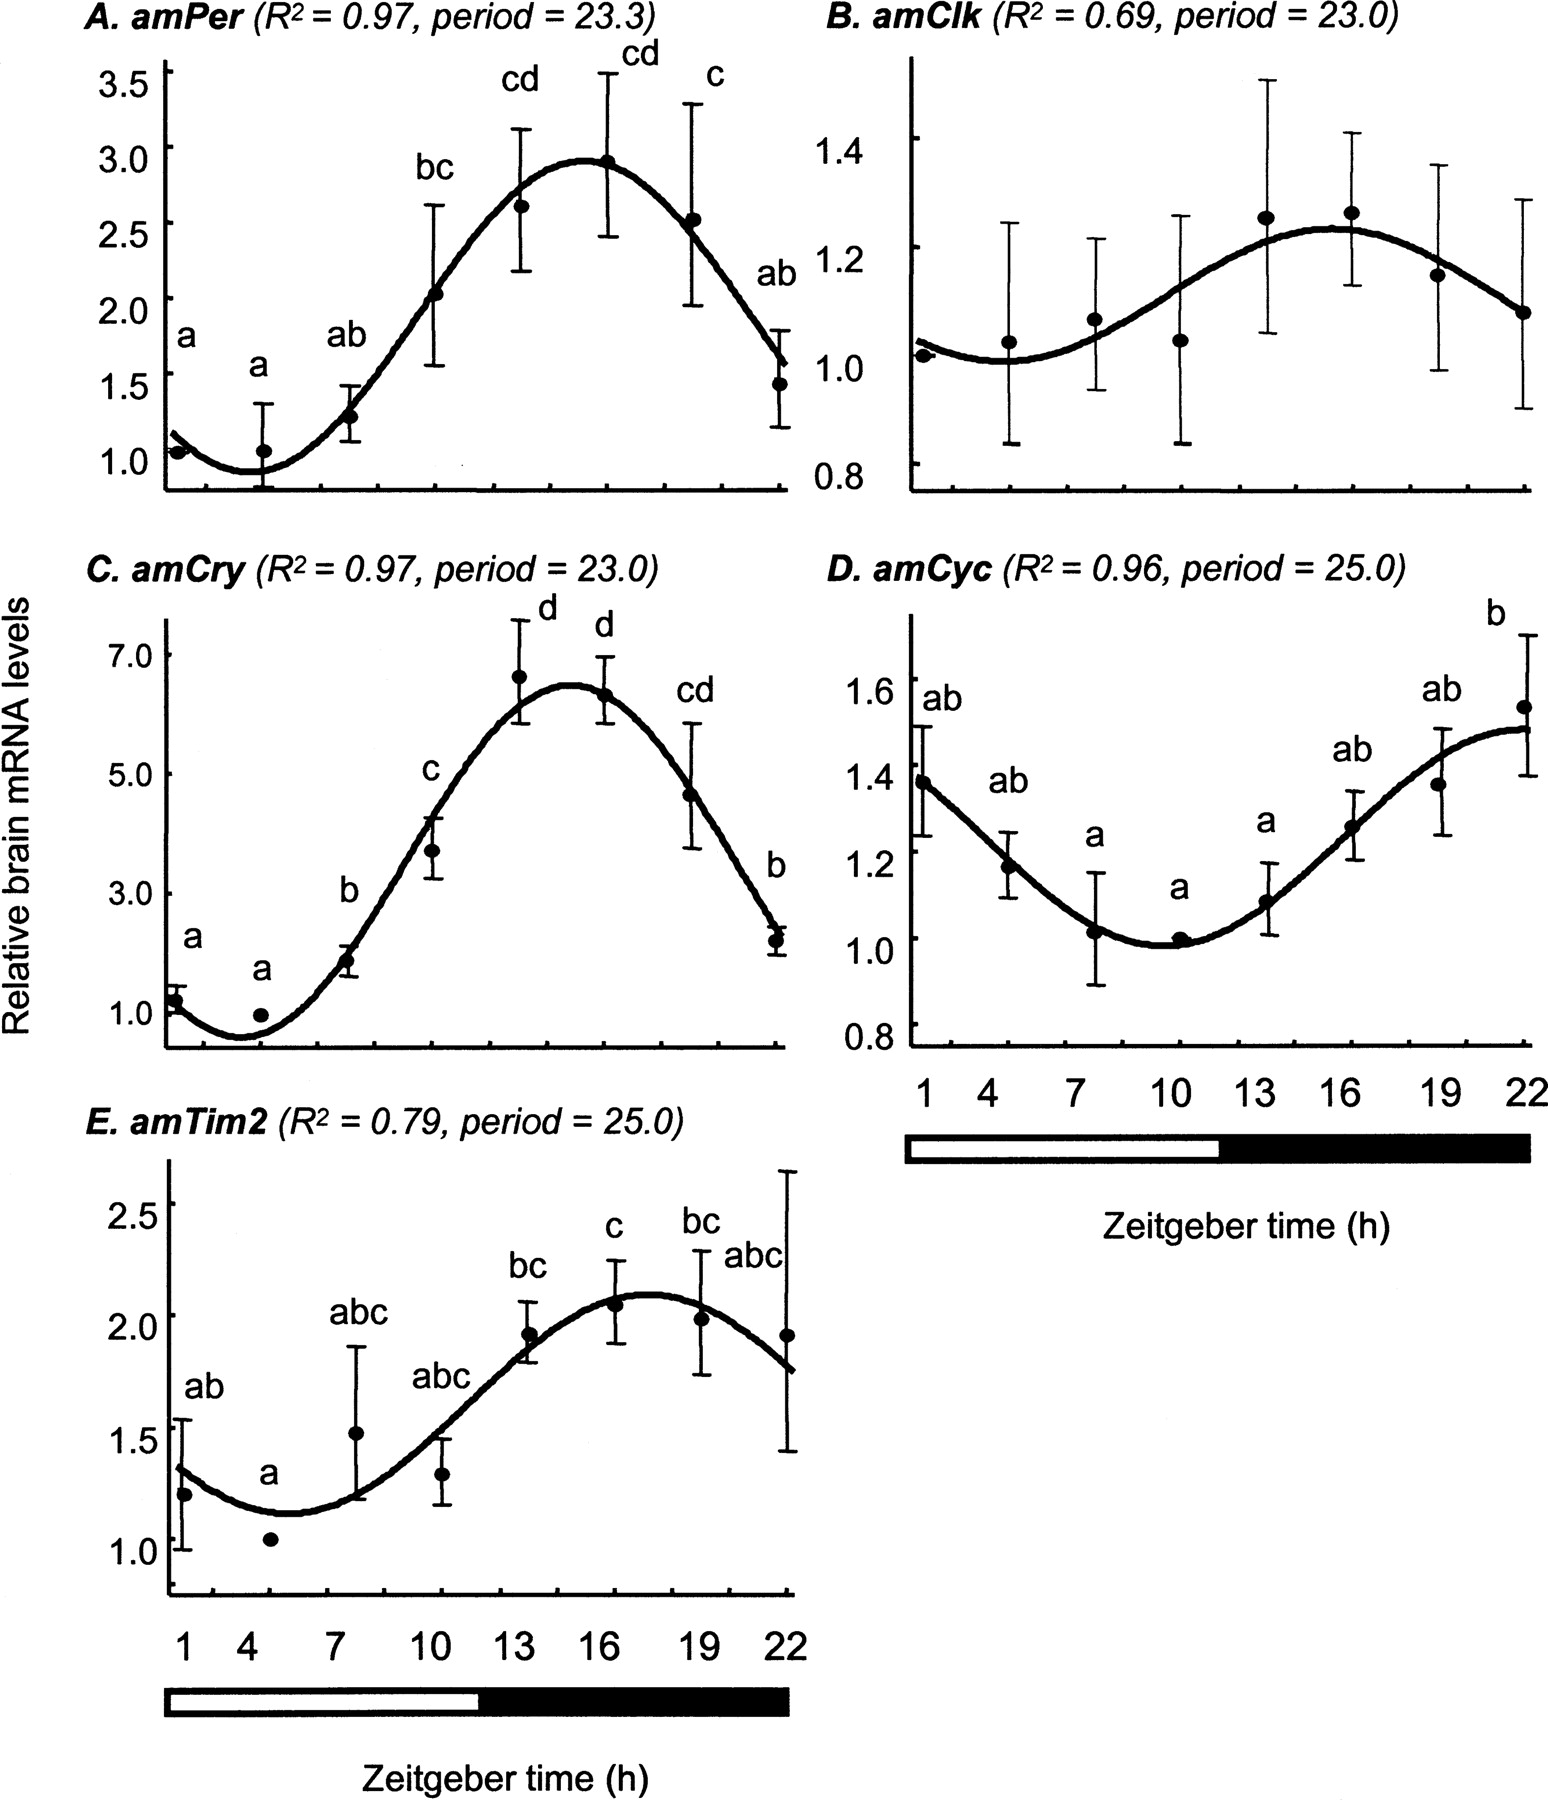
Brain transcript abundance over time in foragers entrained and collected in LD illumination regime. The plots show the correlation between average (±SE) relative mRNA levels for each time point (filled circles and bars) and a cosinus model with a cycle of 23–25 h (continuous line) for bees from colony S1. (A) amPeriod; (B) amClock; (C) amCrypto-chrome; (D) AmCycle; (E) AmTimeout. In parentheses are the adjusted R2 and period of the cosinus model for each gene. Time points with different letters are significantly different (ANOVA, P < 0.05; LSD post hoc test, P < 0.05). In two additional experiments, each with bees from a different, independent colony, we obtained similar results (see text for details). The bars at the bottom of plots indicate the illumination regime during sample collection. Black bar indicates dark; open bar, light. Sample size = 6.


