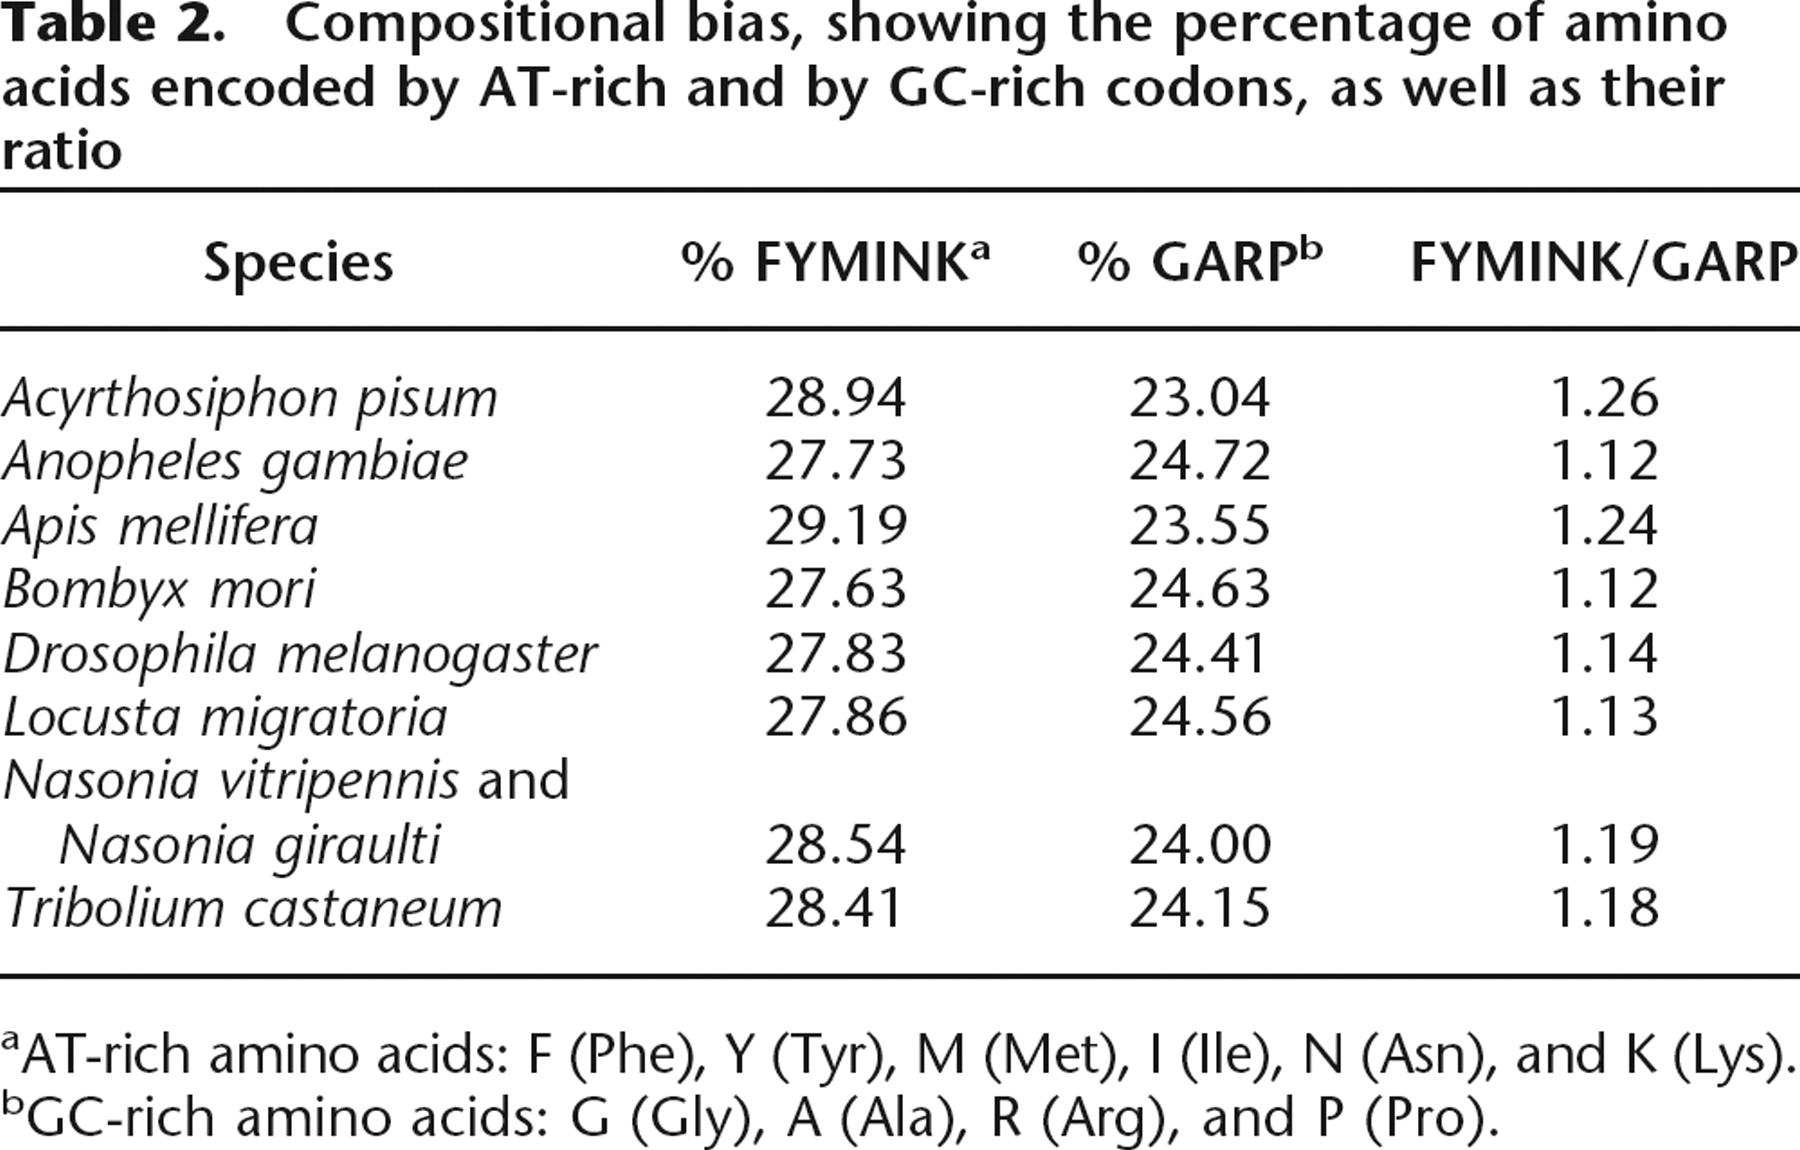
Table 2.
Compositional bias, showing the percentage of amino acids encoded by AT-rich and by GC-rich codons, as well as their ratio settings, where all sequences flanking a
Click on table to view larger version.