
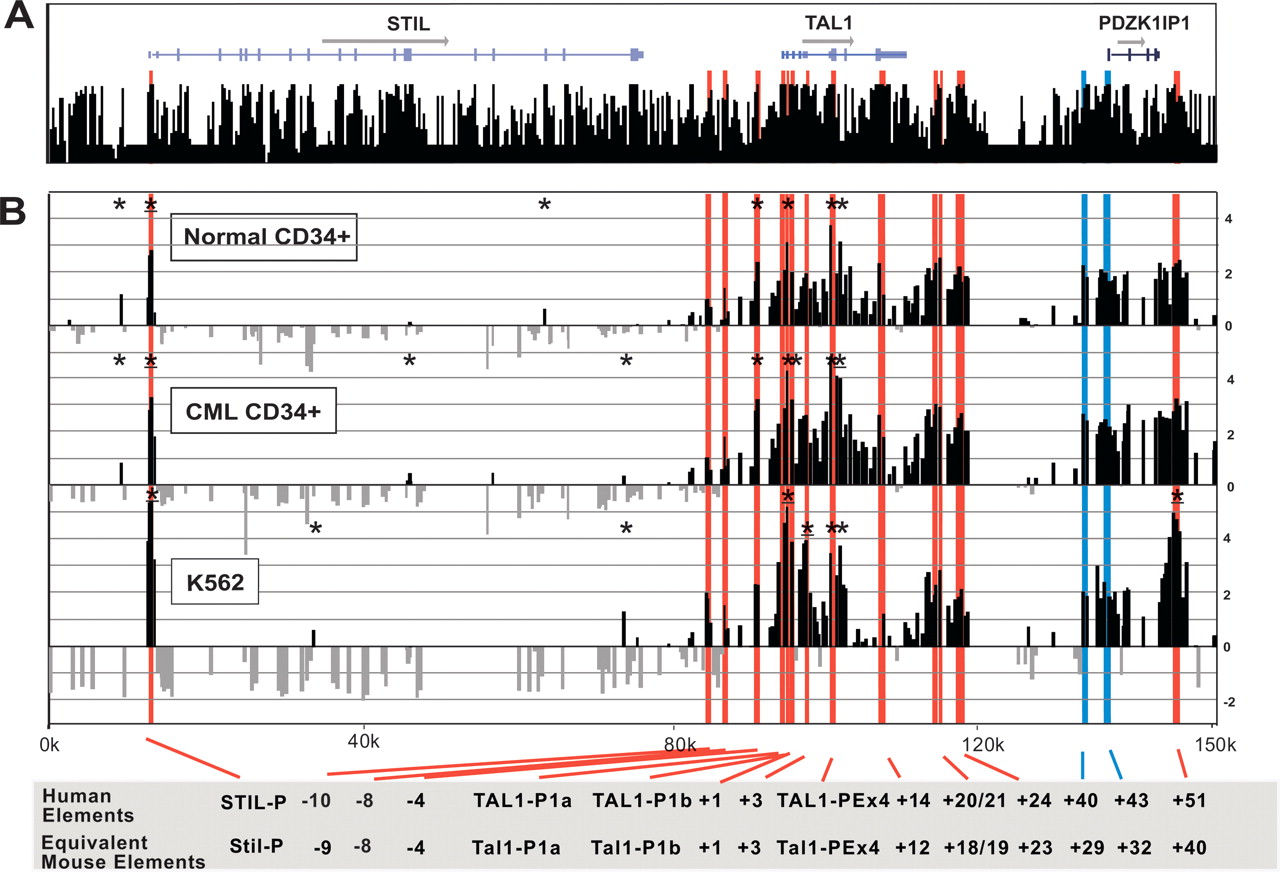
DNaseI hypersensitive site profiles across the human TAL1 locus. (A) Organization of the human STIL, TAL1, and PDZK1IP1 genes, with wide and narrow bars representing translated and untranslated exons, respectively. The black bars represent the human/chimp/mouse/rat/dog/chicken/ Fugu/zebrafish overall conservation score quantified using phastCons (Siepel et al. 2005), derived using the MultiZ species alignment program (http://genome.ucsc.edu) (Hinrichs et al. 2006). (B) DNaseI sensitivity plot from normal donor and CML CD34+ cells and K562 cell lines across the TAL1 locus. Fold enrichment over non-enriched input is plotted (log2) against genomic position in kilobases. The normal donor and K562 plots represent the mean values of four independent array experiments, while the CML data represent the mean of two separate experiments, each hybridized in triplicate as detailed in Methods. The width of each bar represents the width of each spotted PCR product on the array, with overlapping bars representing overlapping PCR products. Red bars represent known regulatory elements or regions homologous to known mouse regulatory elements. The blue bars locate the human region homologous to the novel mouse regulatory elements identified in this study. Significant enrichments (P ≤ 0.05) are indicated with an asterisk or asterisk + bar (at least two adjacent tiles). (0k) Human chromosome 1 coordinate 47,505,065 (NCBI build 35). Functional elements are described in Table 1 and the text, and refer to the location in kilobases of the conserved elements relative to the start of human exon 1a.


