
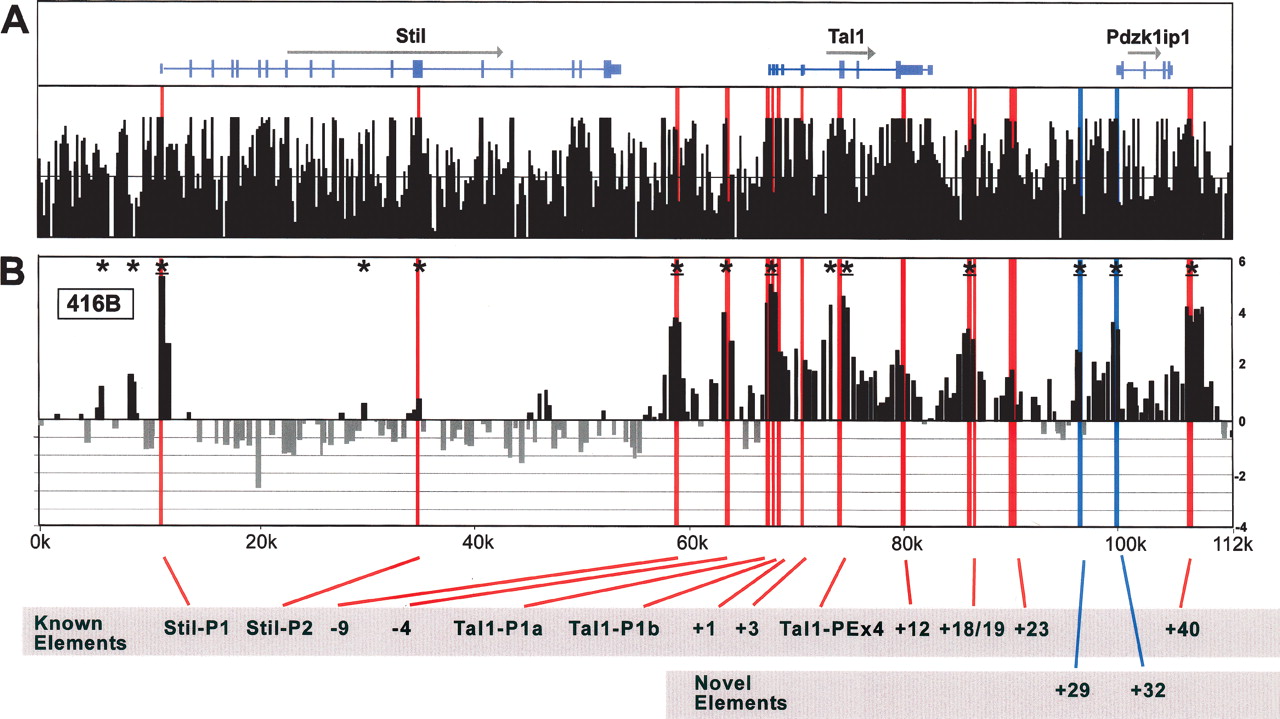
DNaseI hypersensitive site profiles across the mouse Tal1 locus. (A) Organization of the mouse Stil, Tal1, and Pdzk1ip1 genes, with wide and narrow bars representing translated and untranslated exons, respectively. The black bars represent the mouse/rat/human/dog/chicken overall conservation score quantified using phastCons (Siepel et al. 2005), derived using the MultiZ species alignment program (http://genome.ucsc.edu) (Hinrichs et al. 2006). (B) DNaseI sensitivity plot from 416B cells across the Tal1 locus. Fold enrichment over non-enriched input is plotted (log2) against genomic position in kilobases. The plots in B are the means of four independent array experiments, each hybridized in triplicate, as detailed in Methods. The width of each bar represents the width of each spotted PCR product on the array, with overlapping bars representing overlapping PCR products. Red bars represent known regulatory elements, while blue bars represent novel elements identified in this study. Significant enrichments (P ≤ 0.05) are indicated with an asterisk or asterisk + bar (at least two adjacent tiles). (0k) Mouse chromosome 4 coordinate 113,334,279 (NCBI build 33). Functional elements are described in Table 1 and the text, and refer to the location in kilobases relative to the start of mouse Tal1 exon 1a.


