
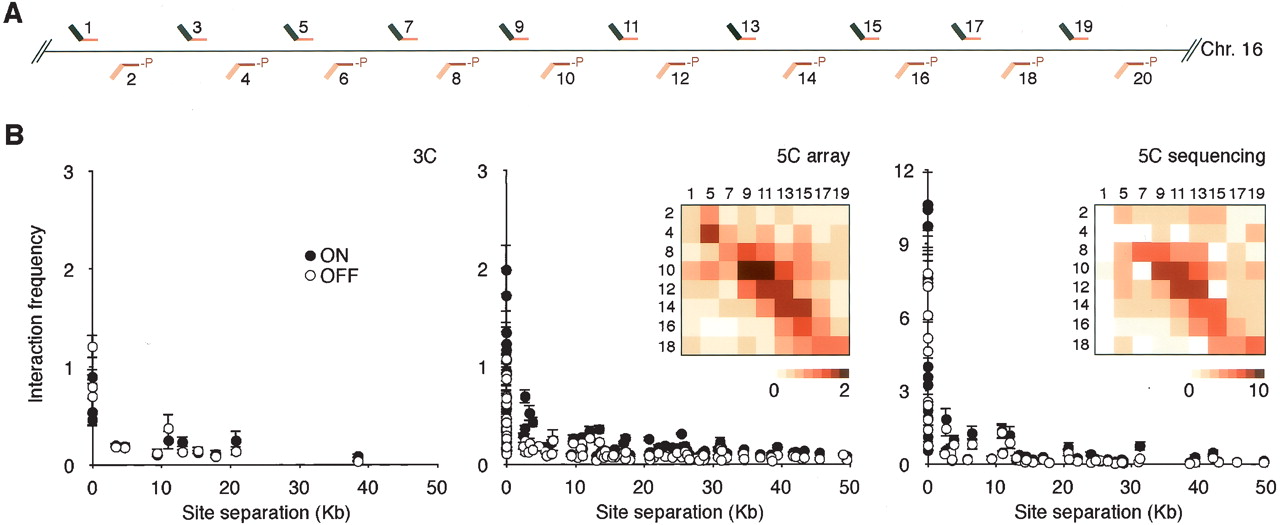
Analysis of the conformation of the gene desert control region. (A) Positions of alternating 5C forward (top) and reverse (bottom) primers throughout the gene desert control region. (B) Chromatin interaction frequencies of the gene desert region as determined by conventional 3C (left panel), by 5C and microarrays (middle panel), and by 5C and quantitative sequencing (right panel). Interaction frequencies are plotted vs. genomic distance between the interacting fragments. Bars represent the S.E.M. Interaction frequencies detected in K562 cells are also presented as two-dimensional heat maps in which the color of each square is a measure of the interaction frequency. Note: Primers 3, 6, and 20 recognize repetitive sequences. These primers were included to generate 5C libraries, but data obtained with these primers are not included in B. Interaction frequencies obtained with these primers are presented in Supplemental Table 7.


