
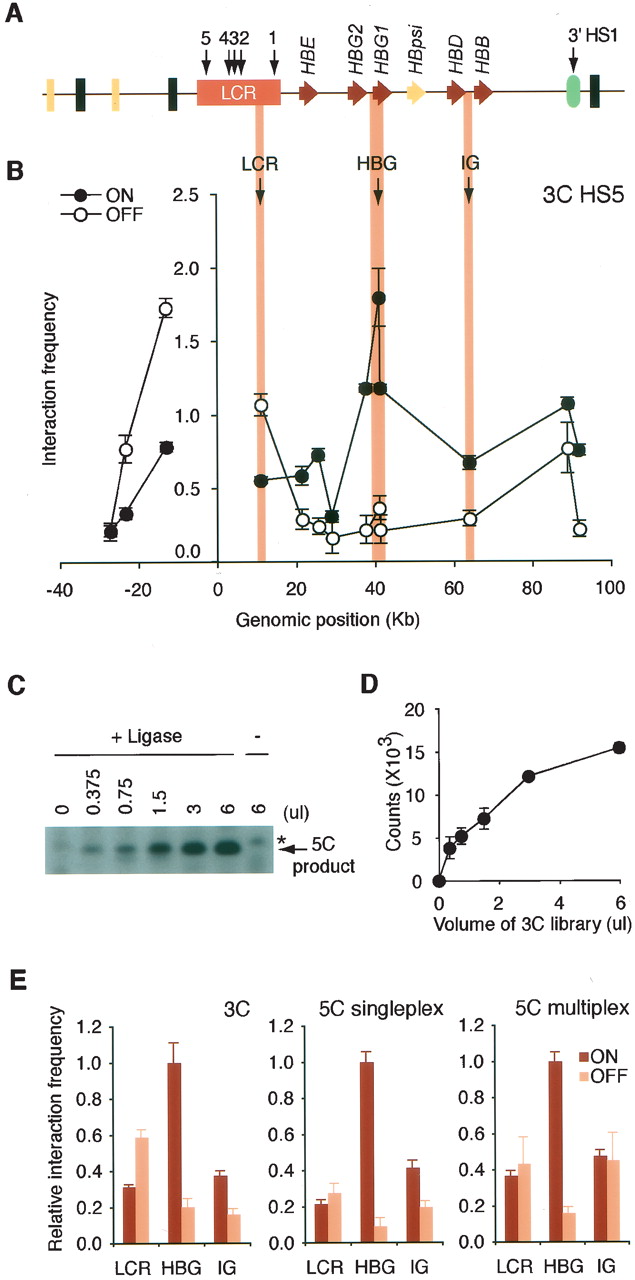
Analysis of the human β-globin locus and development of 5C. (A) Schematic representation of the human β-globin locus. The β-globin genes and pseudogene are illustrated by red and yellow arrows, respectively. The positions of HSs are indicated with black arrows. Olfactory genes and pseudogenes are represented by black and yellow rectangles, respectively. The location of a gene of unknown function (EST BU661736) is indicated by a green oval. (B) 3C analysis of interactions between the LCR (HS5) and the rest of the β-globin locus. Interaction frequencies were measured by semiquantitative PCR in K562 (locus ON) and GM06990 (locus OFF) cells. The y-axis indicates normalized interaction frequencies; the x-axis shows the genomic position relative to the LCR. Each data point is the average of at least three PCR reactions; bars represent the standard error of the mean (S.E.M.). (C) Representative 3C library titration in singleplex LMA with 5C primers. Increasing volumes of 3C library from K562 cells were analyzed with gene desert 5C primers, and the amplified 5C ligation products were analyzed on an agarose gel. An asterisk indicates a nonspecific band. (D) Quantification of titration shown in C. Each data point corresponds to the average of three PCR reactions; bars represent the S.E.M. (E) 3C, singleplex, and sixplex LMA detection of looping interactions between HS5 and the Aγ-globin gene HBG1. Interaction frequencies from both cell lines were expressed relative to the K562 LCR–Aγ-globin interaction (HBG1), which was set at 1. Each histogram value represents the average of at least three PCRs; bars represent the S.E.M.


