
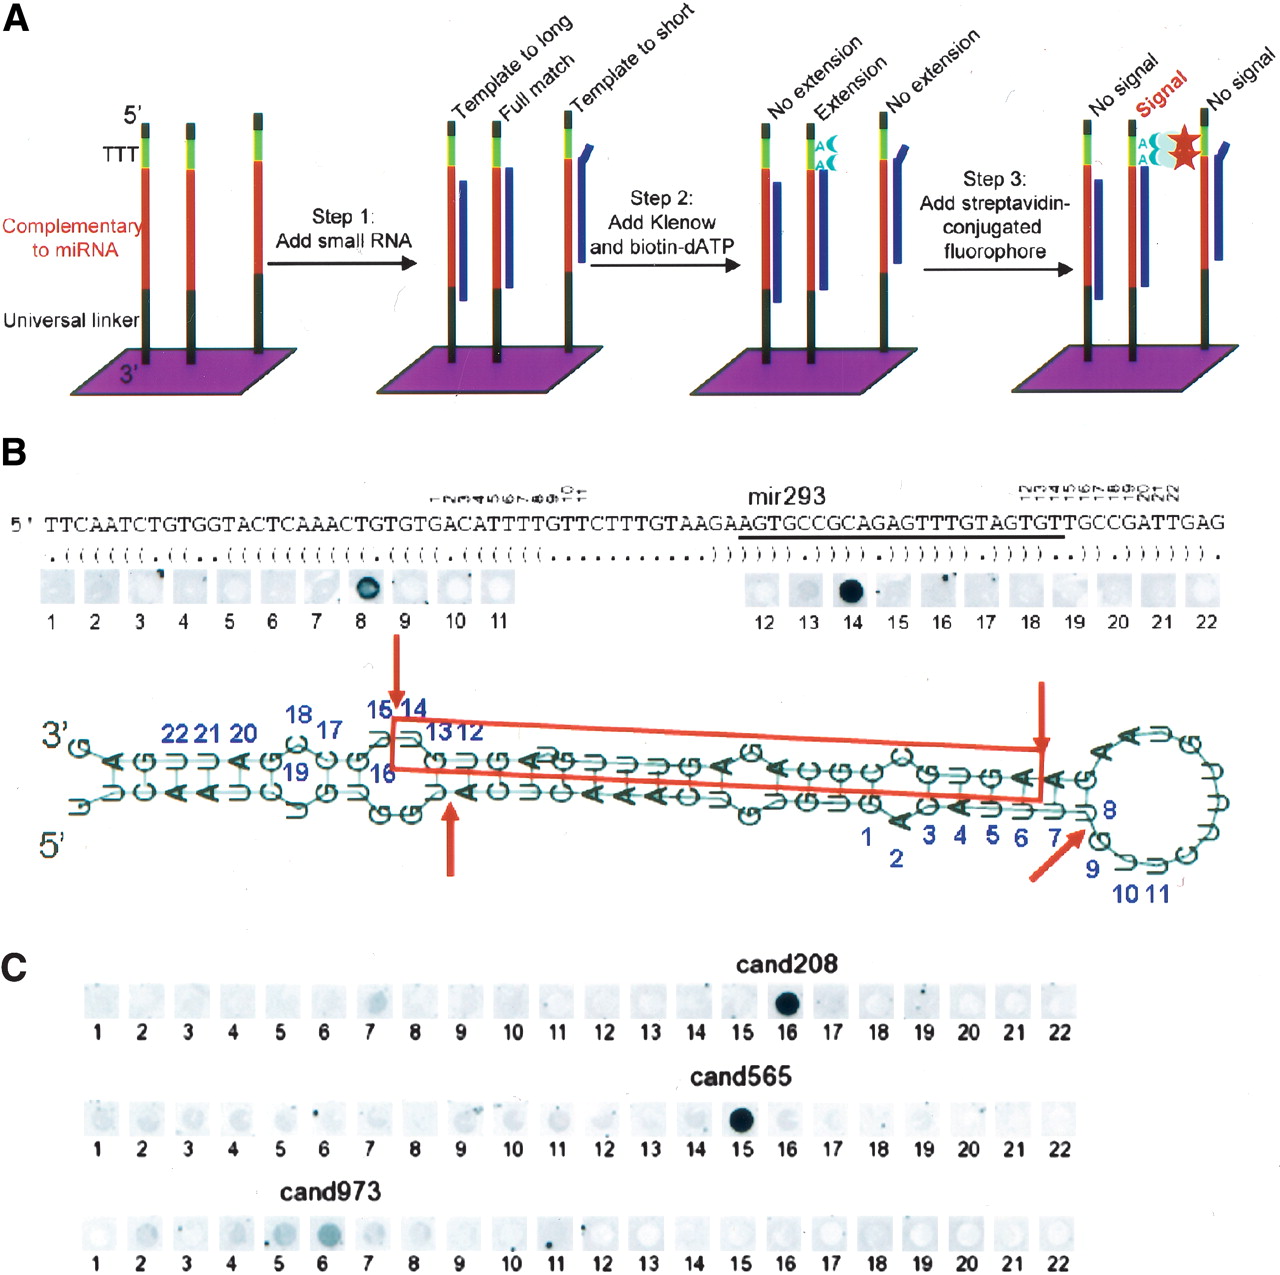
chematic representation of the modified RAKE assay (A) and experimental results obtained for known (B) and novel (C) candidate miRNAs. (A) A 44K microarray with a tiling path of 60-mer probes that are attached with their 3′ end to the glass surface was designed for the Agilent platform. Each DNA probe consists of a universal 3′ spacer sequence (black) followed by 22 nt of sequence complementary to the microRNA candidate (red), three thymidine nucleotides (green), and a short universal spacer (black). Unlabeled small RNA is hybridized to these arrays, followed by a Klenow extension reaction in the presence of biotinylated dATP. As miRNAs function as a primer for extension and the thymidines are the only template for extension, a complete 3′-end match is required for biotin incorporation and streptavidin fluorophore-mediated detection in the final step. (B) Schematic representation of the miR-293 pre-miRNA with predicted secondary structure and RAKE results. The mature miRNA (red) and numbers above the sequence indicate the 3′ end that fully matches the respective tiling path probe on the array. The strongest signal in the RAKE assay is obtained for probe 14, confirming the known 3′ end of miR-293. A weaker signal is obtained for probe 8, consistent with sensitive detection of the star sequence, which is produced as a side product from the hairpin structure by Drosha and Dicer nucleases that cut double-stranded RNA with a 2-nt 3′ overhang. The star sequence cannot be detected for all positive miRNAs. (C) RAKE results for three candidate miRNAs confirm the existence of novel miRNAs and identify the 3′ end of the mature miRNAs. For cand208 the star sequence can be detected (probe 7), whereas for cand973 multiple probes are positive with a rapidly decreasing intensity around the predominant probe, most likely representing imprecise 3′ end processing.


