
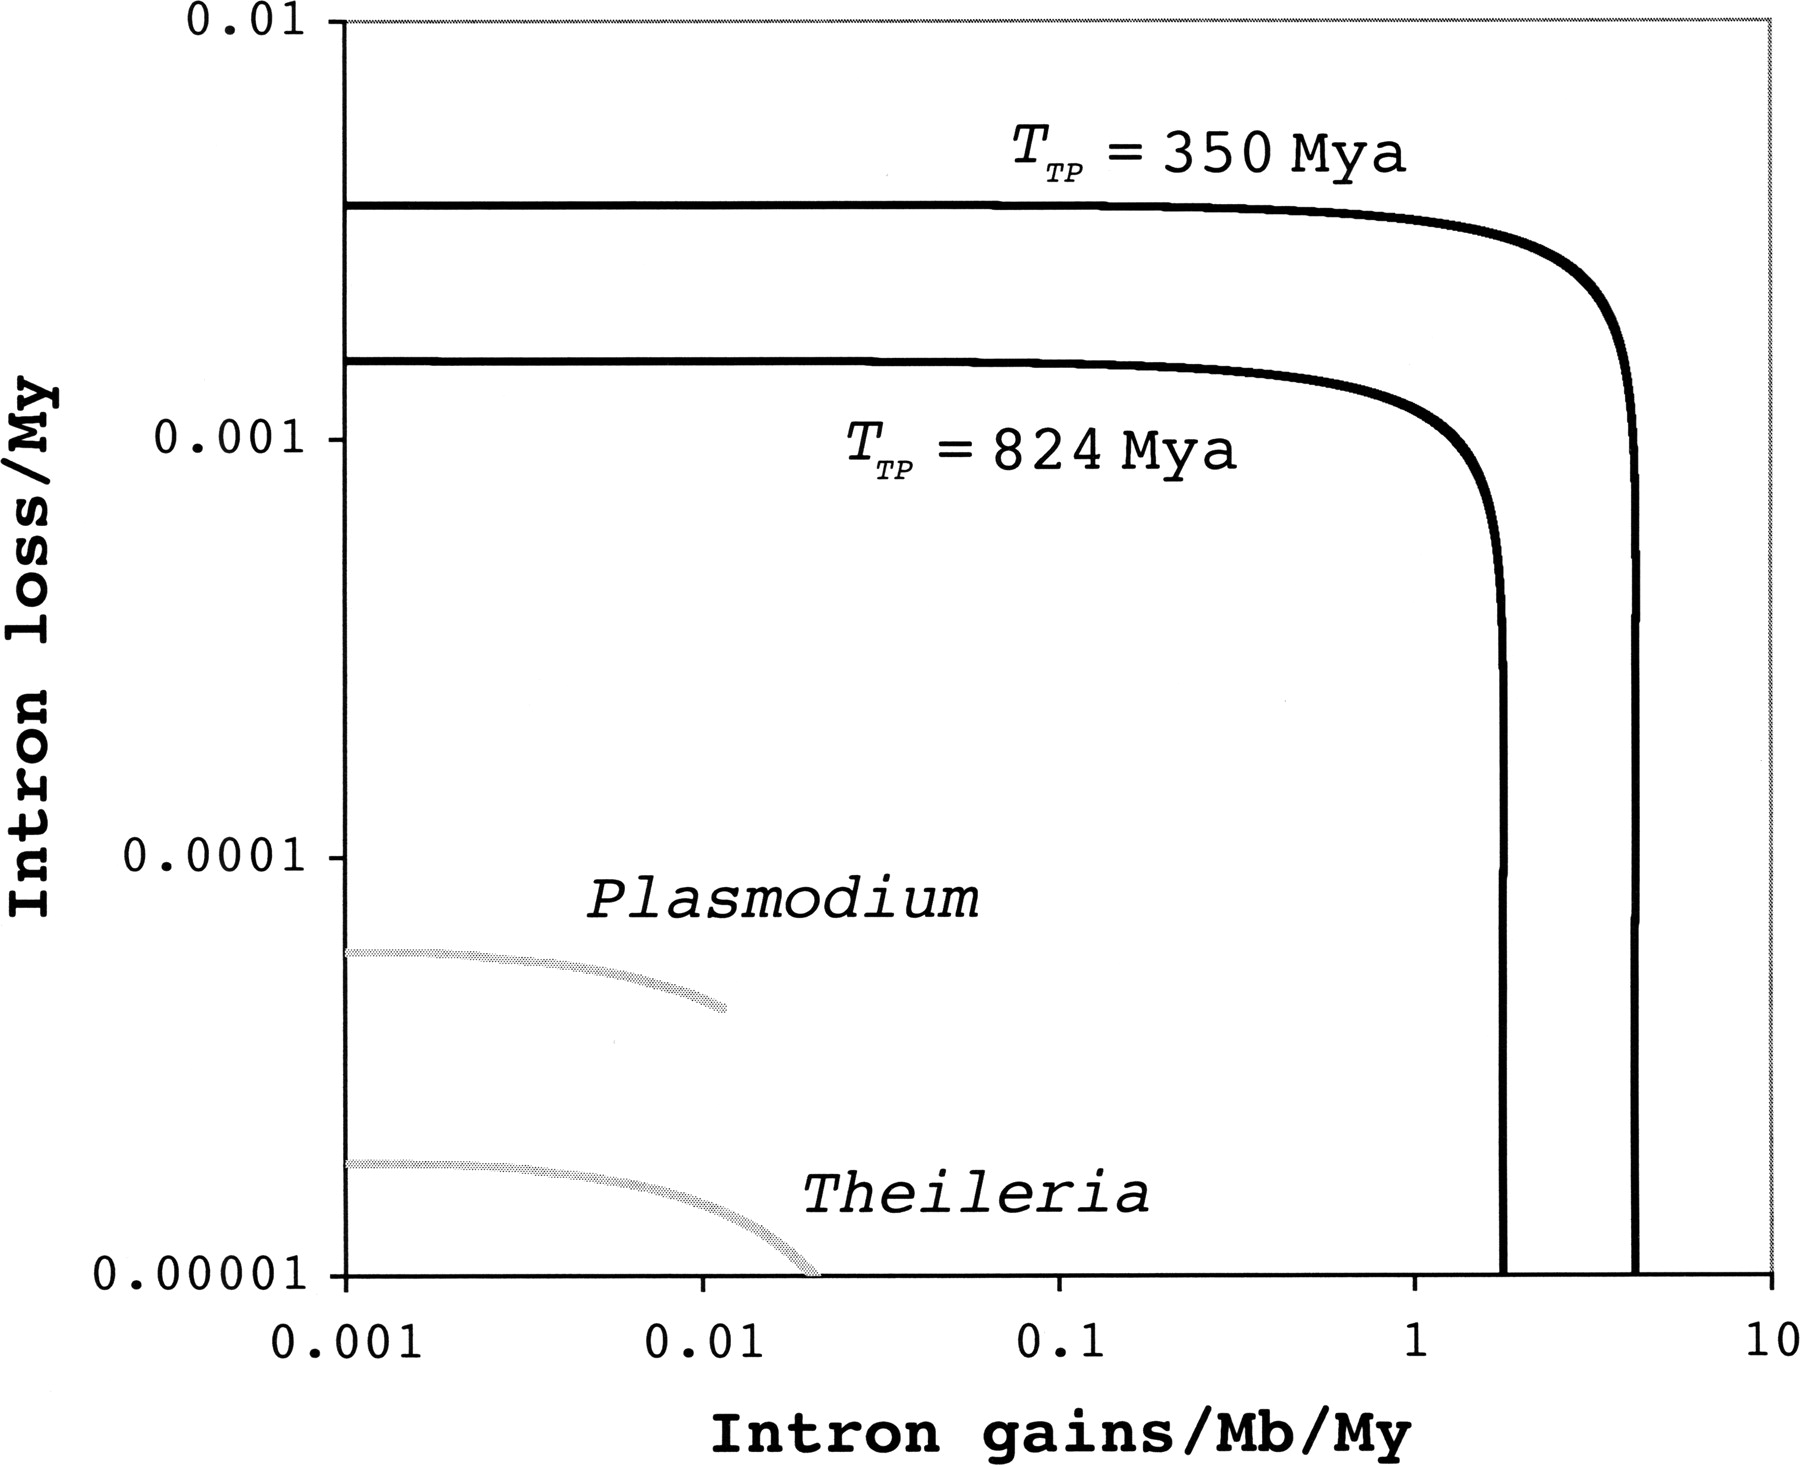
Figure 2.
Estimated rates of intron loss and gain in three comparisons. The Plasmodium and Theileria traces give possible estimates of intron loss and gain for the P. falciparum–P. yoelii and T. parva–T. annulata comparisons, respectively, given the number of observed species-specific intron positions. The black traces give possible estimates derived from the T. parva–P. falciparum comparison, assuming either a divergence time of 350 Mya or 824 Mya. Estimates are derived as described in the text.


