
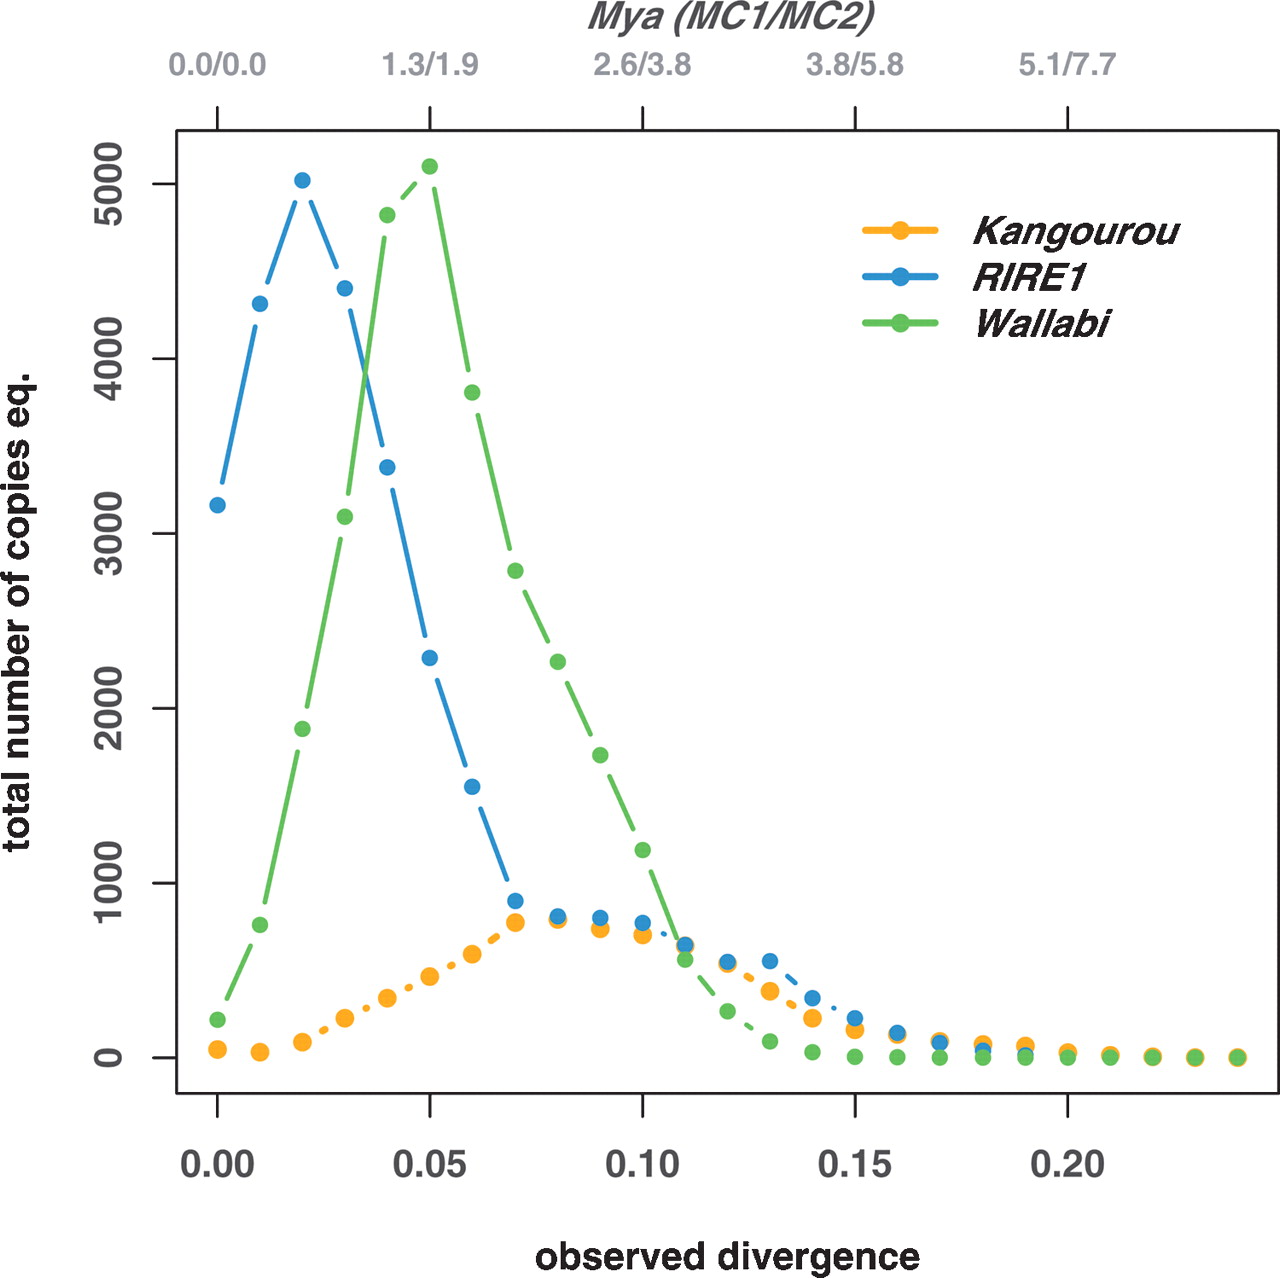
Timing of the bursts of the three retrotransposons, RIRE1, Kangourou, and Wallabi: For each element, the curves represent the distribution of the observed divergence between each paralog (given at the bottom x-axis). Top x-axis represents the date of divergence in Mya translated from the observed divergence, using the two molecular clocks MC1 and MC2 (see Methods section). The groups of paralogs used to compute the pairwise distances are defined within the phenetic subgroups shown in the phenogrammes given in Supplemental data #4. The y-axis represents the total number of copy equivalent, i.e., (the frequency at which the divergence time occurred) × (the number of paralogs in the genome of O. australiensis, based on the dot-blot experiments, Table 1).


